EX-99.2 SECOND QUARTER FINANCIAL RESULTS PRESENTATION
Published on July 29, 2026

Q2 2026 Financial Results July 29th, 2026 April 2026
Forward-looking Statements This presentation contains “forward-looking” statements as defined in the Private Securities Litigation Reform Act of 1995, which are statements that are not historical facts and relate to future conditions, events, or results. These statements are based on management's current expectations or predictions of future conditions, events, or results based on various assumptions and management's estimates of trends and economic factors in the markets in which we are active, as well as our business plans. Words such as “expects,” “anticipates,” “objectives,” “intends,” “plans,” “believes,” “seeks,” “estimates,” “projects,” “forecasts,” “continue,” “may,” “should,” “will,” “goals,” and variations of such words and similar expressions are intended to identify such forward-looking statements. Forward-looking statements include, but are not limited to, statements related to: clinical development activities, including expansion into prostate applications; commercial growth initiatives, including planned expansion of breast and extremities sales specialists; market development opportunities; strategic investments and collaborations, including the anticipated strategic benefits of such investments; expectations regarding disciplined, profitable growth and margin improvement; financial guidance and outlook for 2026, including projected revenue growth, free cash flow, gross margins, and other operating performance metrics; and statements regarding our training and education initiatives, reimbursement and market access efforts, and research and development activities. Actual results or events could differ materially from those described in any forward-looking statements as a result of various factors, including, without limitation, risks related to global supply chain conditions, inflationary pressures, hospital staffing challenges, product development and product potential, clinical enrollment timing and outcomes, regulatory processes and approvals, financial performance, sales growth, surgeon and product adoption, market awareness of our products, data validation, our visibility at and sponsorship of conferences and educational events, geopolitical and macroeconomic conditions, including armed conflicts and government actions or policies that may affect our business, tax position, or regulatory processes, as well as those risk factors described under Part I, Item 1A., “Risk Factors,” of our most recent Annual Report on Form 10-K, subsequent Quarterly Reports on Form 10-Q, and other filings made from time to time with the Securities and Exchange Commission. Forward-looking statements are not a guarantee of future performance, and actual results may differ materially from those projected. Forward-looking statements speak only as of the date they are made and, except as required by applicable law, we assume no responsibility to publicly update or revise any forward-looking statements. 2 About Non-GAAP Financial Measures To supplement our condensed consolidated financial statements, we use the non-GAAP financial measures of EBITDA, which measures earnings before interest, income taxes, depreciation and amortization, EBITDA margin, and Adjusted EBITDA, which further excludes non-cash stock-based compensation expense and the loss on extinguishment of debt, and Adjusted EBITDA margin. We also use the non-GAAP financial measures of Adjusted Net Income and Adjusted Net Income Per Common Share - diluted which excludes non-cash stock-based compensation expense and the loss on extinguishment of debt from Net Loss and Net Loss Per Common Share - diluted. Additionally, we use the non-GAAP financial measure of Free Cash Flow which consists of net cash provided by operating activities, less expenditures for property and equipment, and intangible assets. These non-GAAP measures are not based on any comprehensive set of accounting rules or principles and should not be considered a substitute for, or superior to, financial measures calculated in accordance with GAAP and may be different from non-GAAP measures used by other companies. In addition, these non-GAAP measures should be read in conjunction with our financial statements prepared in accordance with GAAP. The reconciliations of the non-GAAP measures to the most directly comparable financial measures calculated and presented in accordance with GAAP should be carefully evaluated. We use these non-GAAP financial measures for financial and operational decision-making and as a means to evaluate period-to-period comparisons. We believe that these non-GAAP financial measures provide meaningful supplemental information regarding our performance and that both management and investors benefit from referring to these non-GAAP financial measures in assessing our performance and when planning, forecasting, and analyzing future periods. We believe these non-GAAP financial measures are useful to investors because (1) they allow for greater transparency with respect to key metrics used by management in its financial and operational decision-making and (2) they are used by our institutional investors and the analyst community to help them analyze the performance of our business.
3 Q2 2026 Business Highlights and 2026 Goals Michael Dale President and Chief Executive Officer
Agenda 4 1.Q2 2026 Business Highlights Michael Dale, President and Chief Executive Officer 2.Q2 2026 Financials and 2026 Guidance Lindsey Hartley, Chief Financial Officer 3.Q&A Michael Dale, Lindsey Hartley, Jens Kemp, Chief Marketing Officer Rick Ditto, VP Global Health Economics, Reimbursement & Policy
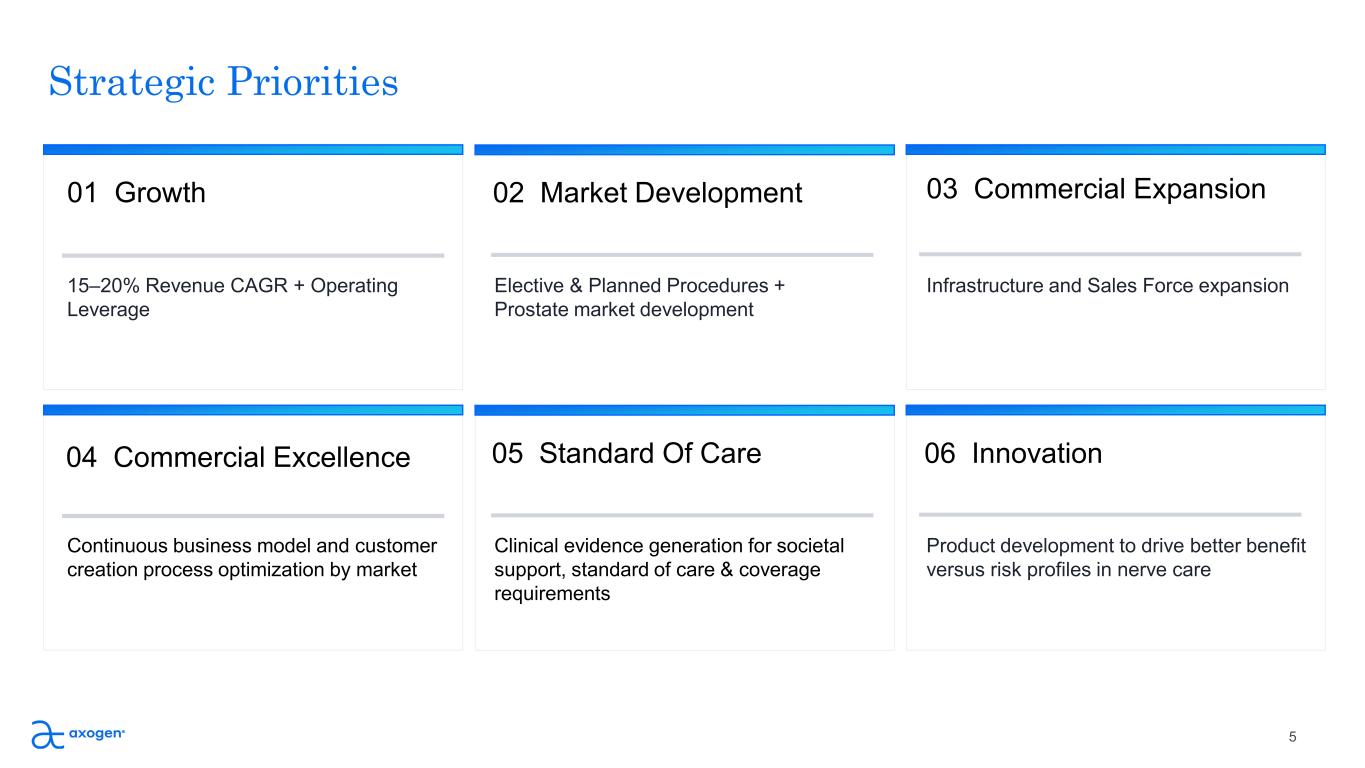
Strategic Priorities 01 Growth 15–20% Revenue CAGR + Operating Leverage 02 Market Development Elective & Planned Procedures + Prostate market development 03 Commercial Expansion Infrastructure and Sales Force expansion 04 Commercial Excellence Continuous business model and customer creation process optimization by market 05 Standard Of Care Clinical evidence generation for societal support, standard of care & coverage requirements 06 Innovation Product development to drive better benefit versus risk profiles in nerve care 5
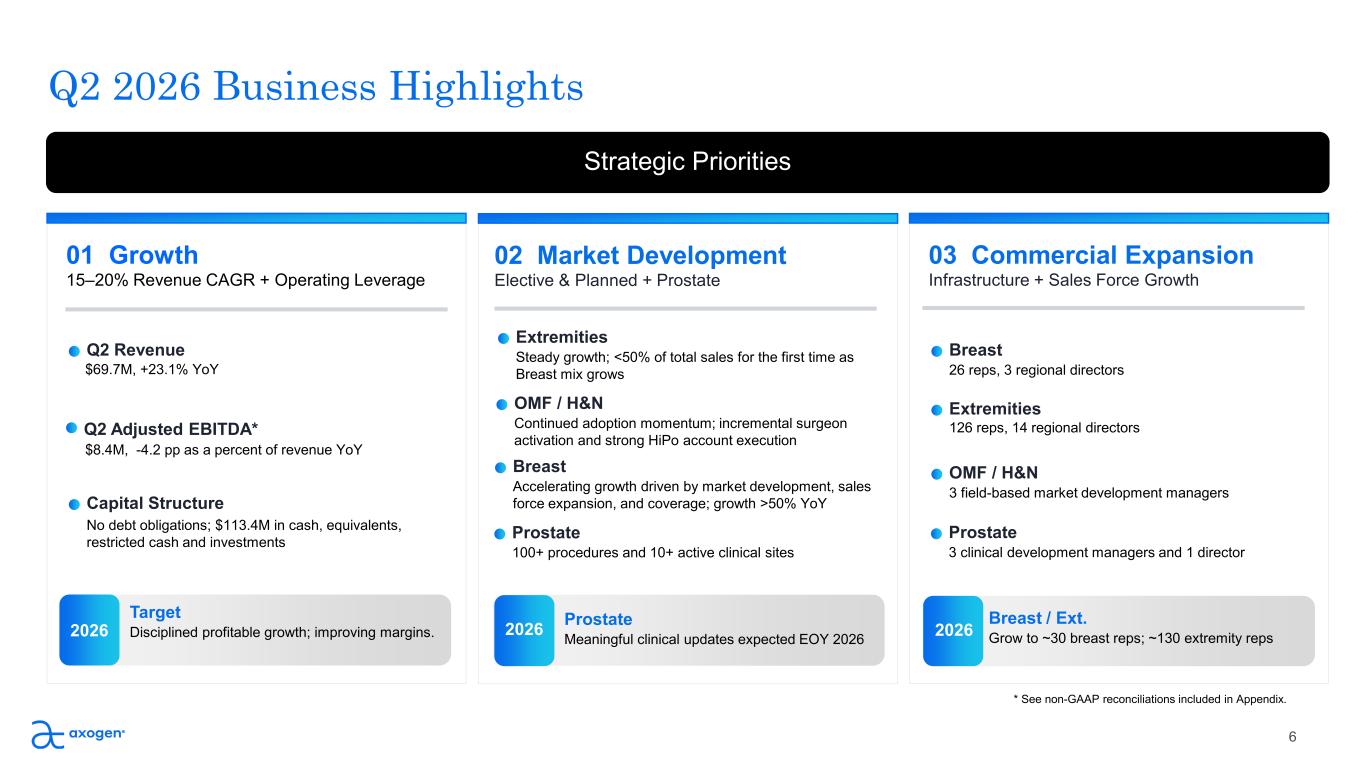
6 Strategic Priorities Q2 2026 Business Highlights 01 Growth 15–20% Revenue CAGR + Operating Leverage Q2 Revenue $69.7M, +23.1% YoY Capital Structure No debt obligations; $113.4M in cash, equivalents, restricted cash and investments 2026 Target Disciplined profitable growth; improving margins. 02 Market Development Elective & Planned + Prostate Extremities Steady growth; <50% of total sales for the first time as Breast mix grows OMF / H&N Continued adoption momentum; incremental surgeon activation and strong HiPo account execution Breast Accelerating growth driven by market development, sales force expansion, and coverage; growth >50% YoY Prostate 100+ procedures and 10+ active clinical sites 2026 Prostate Meaningful clinical updates expected EOY 2026 03 Commercial Expansion Infrastructure + Sales Force Growth Breast 26 reps, 3 regional directors Extremities 126 reps, 14 regional directors OMF / H&N 3 field-based market development managers Prostate 3 clinical development managers and 1 director 2026 Breast / Ext. Grow to ~30 breast reps; ~130 extremity reps 6 Q2 Adjusted EBITDA* $8.4M, -4.2 pp as a percent of revenue YoY * See non-GAAP reconciliations included in Appendix.
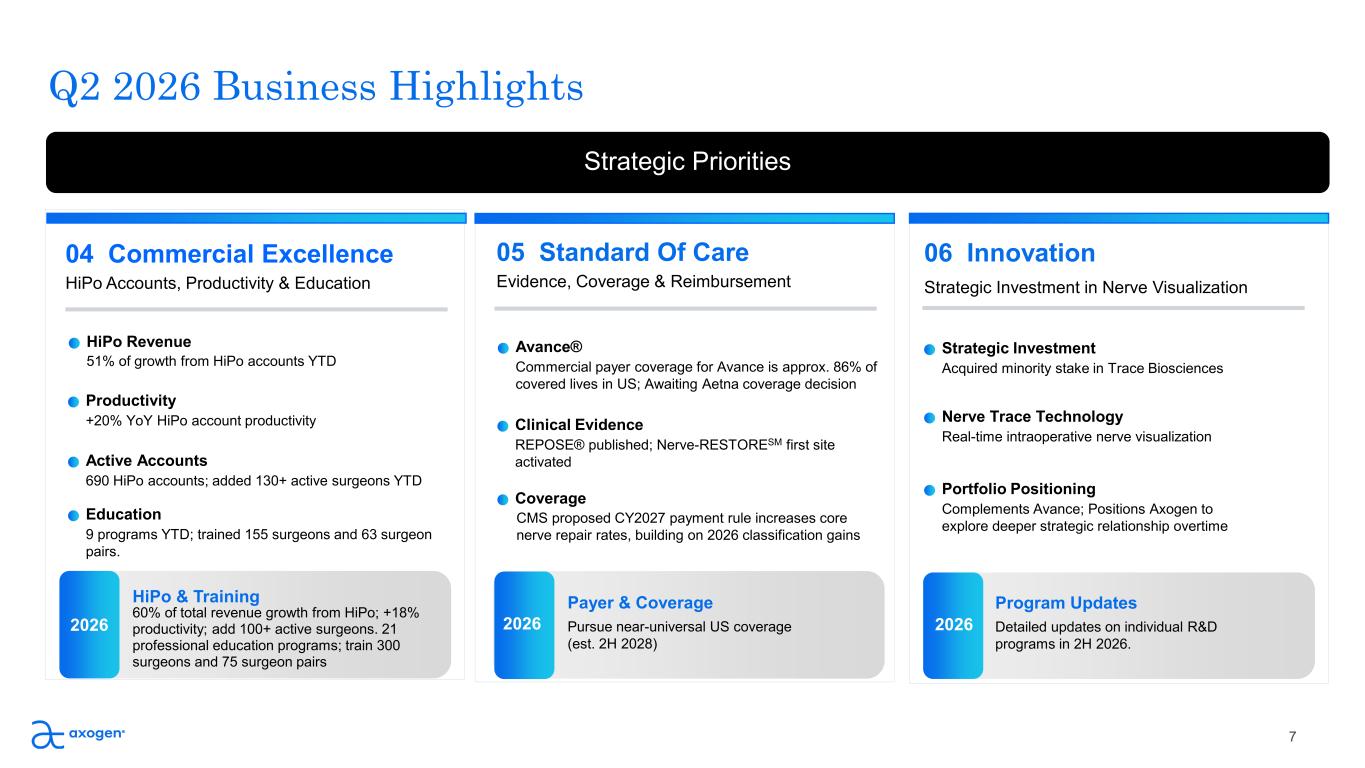
7 Strategic Priorities Q2 2026 Business Highlights 2026 2026 2026 04 Commercial Excellence HiPo Accounts, Productivity & Education HiPo Revenue 51% of growth from HiPo accounts YTD Productivity +20% YoY HiPo account productivity Active Accounts 690 HiPo accounts; added 130+ active surgeons YTD Education 9 programs YTD; trained 155 surgeons and 63 surgeon pairs. HiPo & Training 60% of total revenue growth from HiPo; +18% productivity; add 100+ active surgeons. 21 professional education programs; train 300 surgeons and 75 surgeon pairs 05 Standard Of Care Evidence, Coverage & Reimbursement Avance® Commercial payer coverage for Avance is approx. 86% of covered lives in US; Awaiting Aetna coverage decision Clinical Evidence REPOSE® published; Nerve-RESTORESM first site activated Coverage CMS proposed CY2027 payment rule increases core nerve repair rates, building on 2026 classification gains Payer & Coverage Pursue near-universal US coverage (est. 2H 2028) 06 Innovation Strategic Investment in Nerve Visualization Program Updates Detailed updates on individual R&D programs in 2H 2026. Strategic Investment Acquired minority stake in Trace Biosciences Nerve Trace Technology Real-time intraoperative nerve visualization Portfolio Positioning Complements Avance; Positions Axogen to explore deeper strategic relationship overtime 7

8 Q2 Financials and 2026 Guidance Discussion Lindsey Hartley Chief Financial Officer
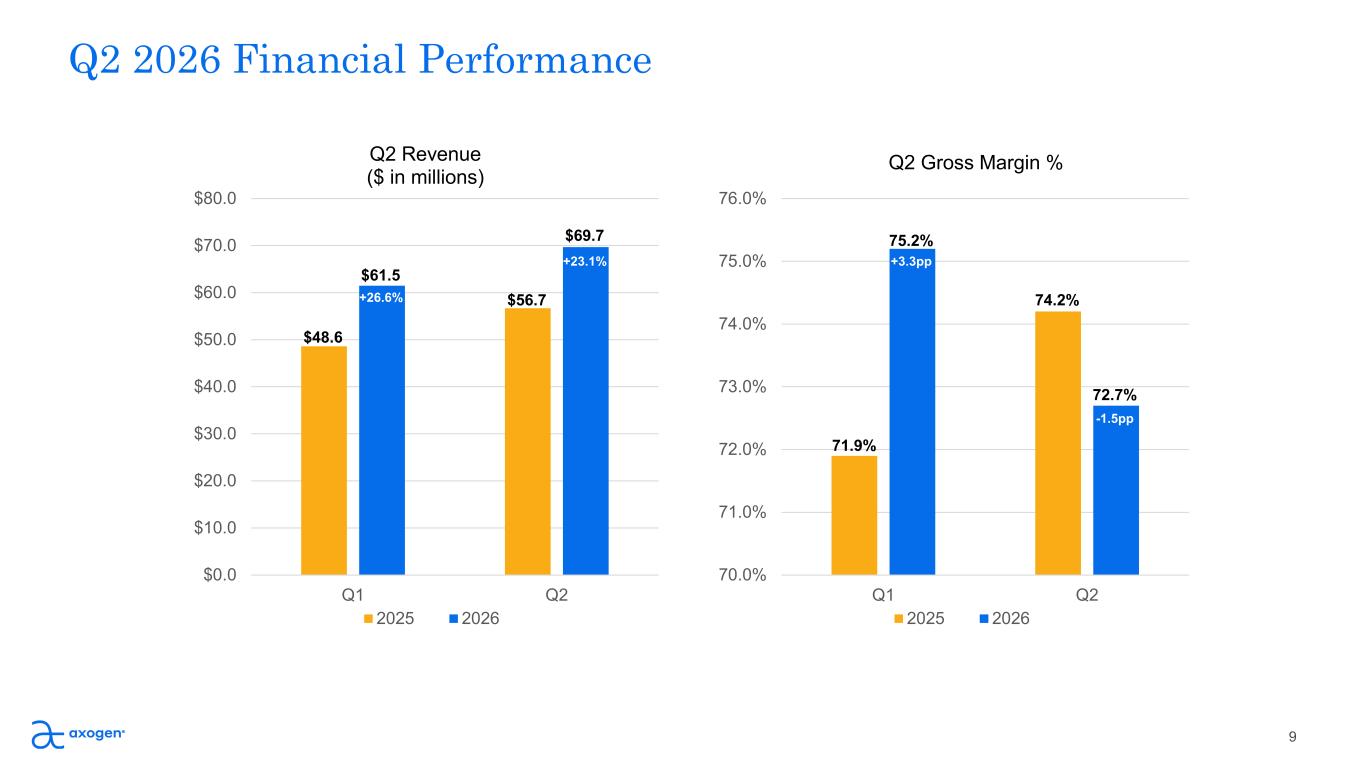
Q2 2026 Financial Performance 9 +26.6% $0.0 $10.0 $20.0 $30.0 $40.0 $50.0 $60.0 $70.0 $80.0 Q1 Q2 Q2 Revenue ($ in millions) 2025 2026 $69.7 $56.7 +23.1% $61.5 $48.6 +26.6% 70.0% 71.0% 72.0% 73.0% 74.0% 75.0% 76.0% Q1 Q2 Q2 Gross Margin % 2025 2026 72.7% 74.2% -1.5pp 75.2% 71.9% +3.3pp
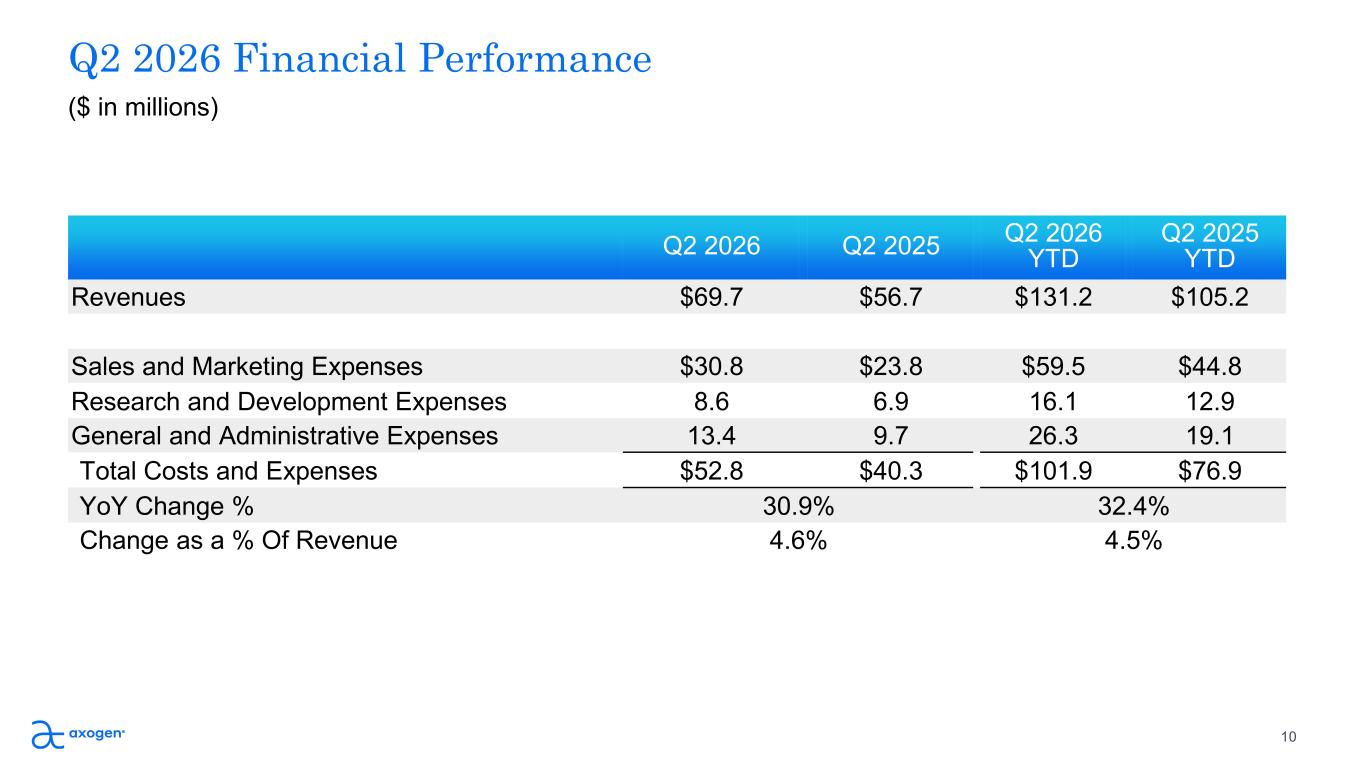
Q2 2026 Financial Performance 10 Q2 2026 Q2 2025 Q2 2026 YTD Q2 2025 YTD Revenues $69.7 $56.7 $131.2 $105.2 Sales and Marketing Expenses $30.8 $23.8 $59.5 $44.8 Research and Development Expenses 8.6 6.9 16.1 12.9 General and Administrative Expenses 13.4 9.7 26.3 19.1 Total Costs and Expenses $52.8 $40.3 $101.9 $76.9 YoY Change % 30.9% 32.4% Change as a % Of Revenue 4.6% 4.5% ($ in millions)
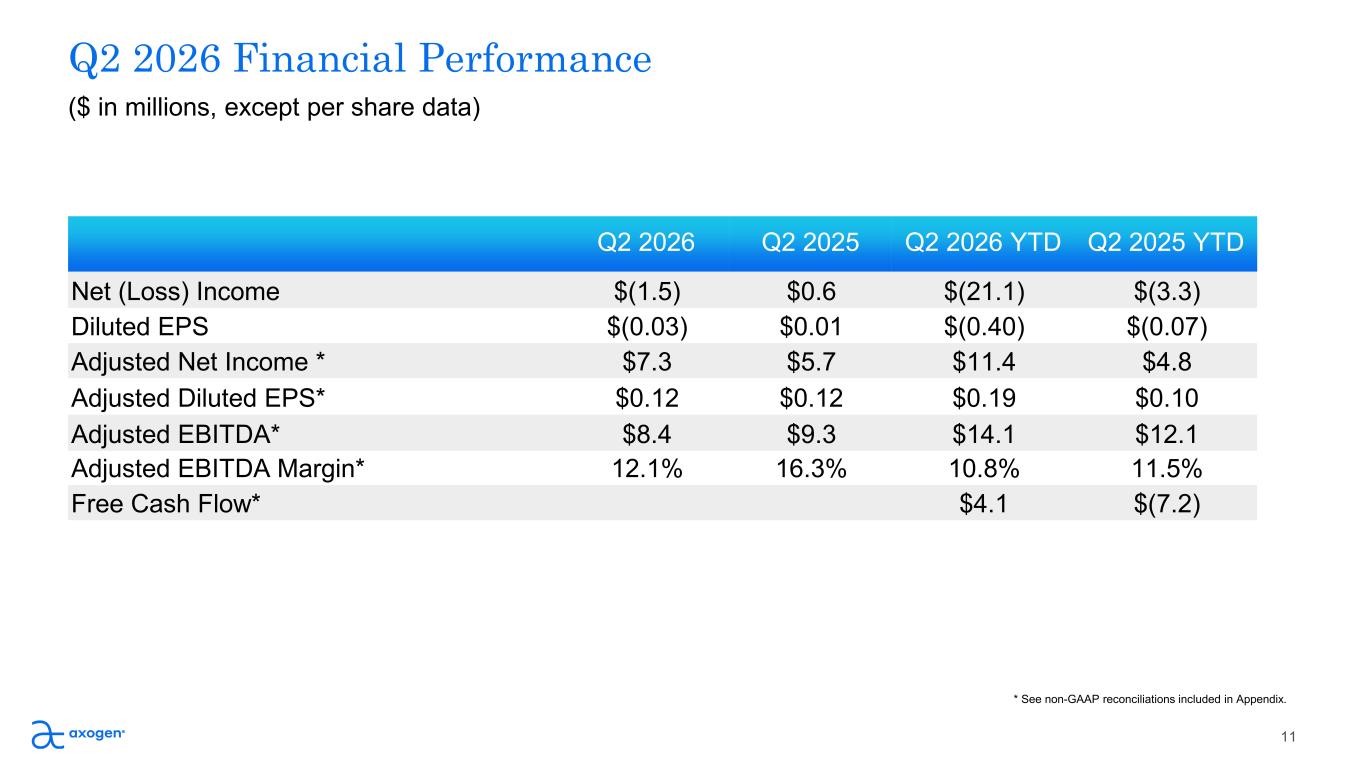
11 Q2 2026 Q2 2025 Q2 2026 YTD Q2 2025 YTD Net (Loss) Income $(1.5) $0.6 $(21.1) $(3.3) Diluted EPS $(0.03) $0.01 $(0.40) $(0.07) Adjusted Net Income * $7.3 $5.7 $11.4 $4.8 Adjusted Diluted EPS* $0.12 $0.12 $0.19 $0.10 Adjusted EBITDA* $8.4 $9.3 $14.1 $12.1 Adjusted EBITDA Margin* 12.1% 16.3% 10.8% 11.5% Free Cash Flow* $4.1 $(7.2) Q2 2026 Financial Performance ($ in millions, except per share data) * See non-GAAP reconciliations included in Appendix.
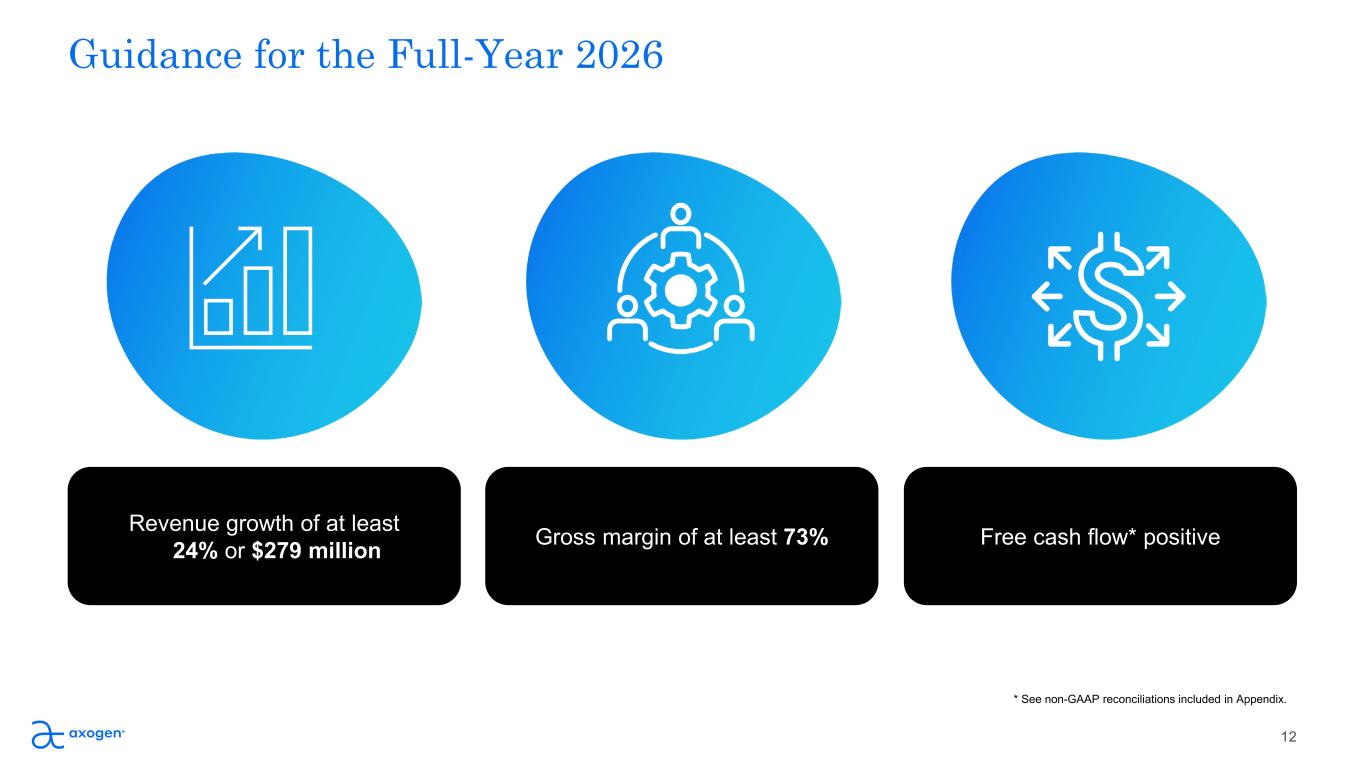
Guidance for the Full-Year 2026 12 Free cash flow* positiveGross margin of at least 73%Revenue growth of at least 24% or $279 million * See non-GAAP reconciliations included in Appendix.

President and Chief Executive Officer Michael Dale Chief Marketing Officer Jens Kemp VP, Global Health Economics, Reimbursement & Policy Rick Ditto 13 Chief Financial Officer Lindsey Hartley Q&A

Thank you © 2026 Axogen Corporation. All rights reserved. The stylized "a" logo is a registered trademark of Axogen Corporation.Mat #

Appendix 15
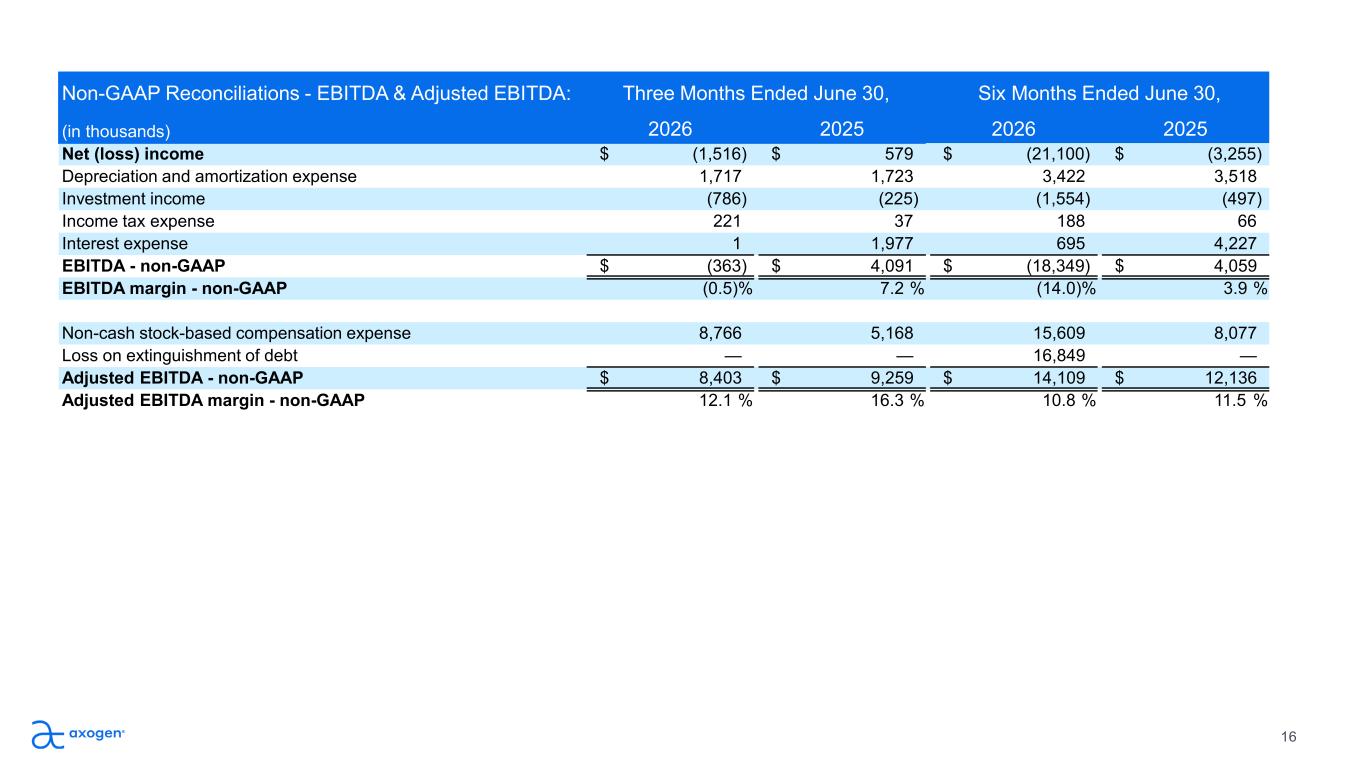
16 Non-GAAP Reconciliations - EBITDA & Adjusted EBITDA: Three Months Ended June 30, Six Months Ended June 30, (in thousands) 2026 2025 2026 2025 Net (loss) income $ (1,516) $ 579 $ (21,100) $ (3,255) Depreciation and amortization expense 1,717 1,723 3,422 3,518 Investment income (786) (225) (1,554) (497) Income tax expense 221 37 188 66 Interest expense 1 1,977 695 4,227 EBITDA - non-GAAP $ (363) $ 4,091 $ (18,349) $ 4,059 EBITDA margin - non-GAAP (0.5)% 7.2 % (14.0)% 3.9 % Non-cash stock-based compensation expense 8,766 5,168 15,609 8,077 Loss on extinguishment of debt — — 16,849 — Adjusted EBITDA - non-GAAP $ 8,403 $ 9,259 $ 14,109 $ 12,136 Adjusted EBITDA margin - non-GAAP 12.1 % 16.3 % 10.8 % 11.5 %
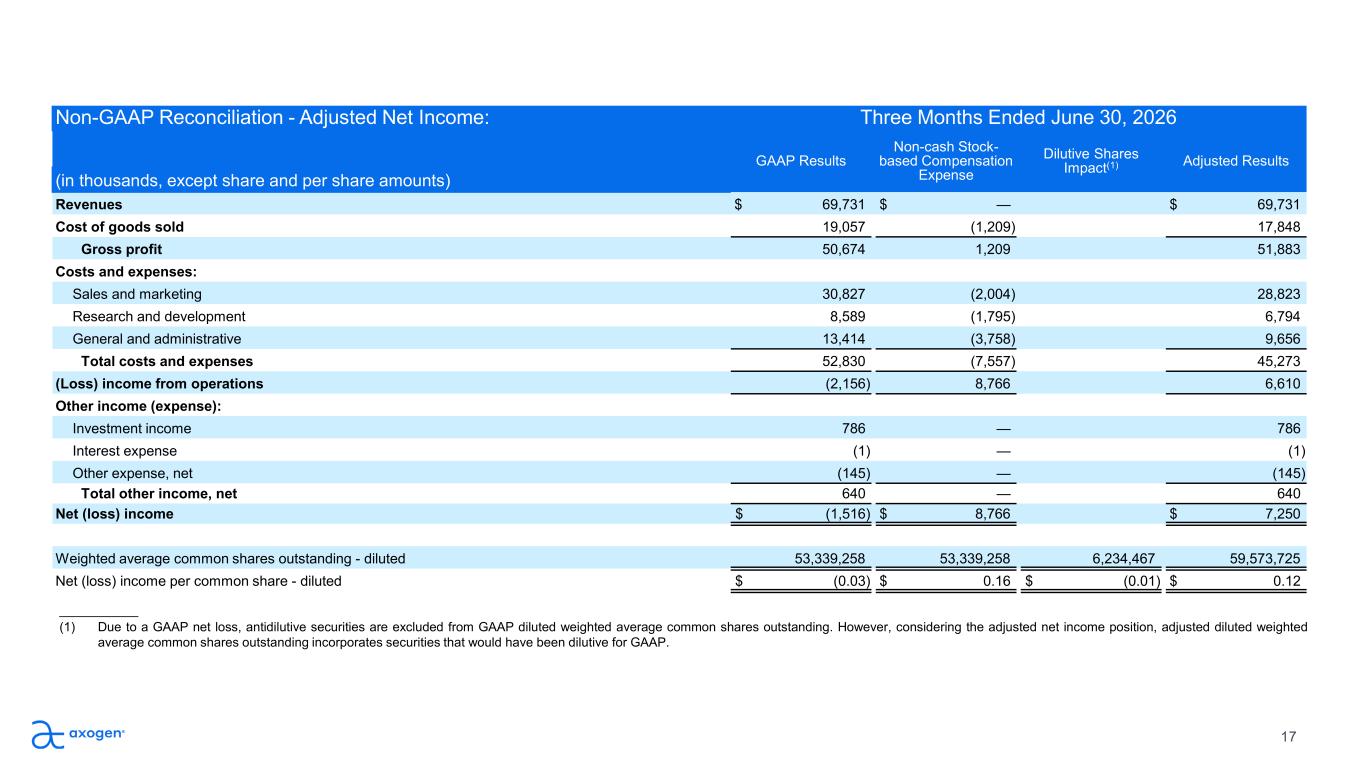
17 Non-GAAP Reconciliation - Adjusted Net Income: Three Months Ended June 30, 2026 GAAP Results Non-cash Stock- based Compensation Expense Dilutive Shares Impact(1) Adjusted Results (in thousands, except share and per share amounts) Revenues $ 69,731 $ — $ 69,731 Cost of goods sold 19,057 (1,209) 17,848 Gross profit 50,674 1,209 51,883 Costs and expenses: Sales and marketing 30,827 (2,004) 28,823 Research and development 8,589 (1,795) 6,794 General and administrative 13,414 (3,758) 9,656 Total costs and expenses 52,830 (7,557) 45,273 (Loss) income from operations (2,156) 8,766 6,610 Other income (expense): Investment income 786 — 786 Interest expense (1) — (1) Other expense, net (145) — (145) Total other income, net 640 — 640 Net (loss) income $ (1,516) $ 8,766 $ 7,250 Weighted average common shares outstanding - diluted 53,339,258 53,339,258 6,234,467 59,573,725 Net (loss) income per common share - diluted $ (0.03) $ 0.16 $ (0.01) $ 0.12 ___________ (1) Due to a GAAP net loss, antidilutive securities are excluded from GAAP diluted weighted average common shares outstanding. However, considering the adjusted net income position, adjusted diluted weighted average common shares outstanding incorporates securities that would have been dilutive for GAAP.
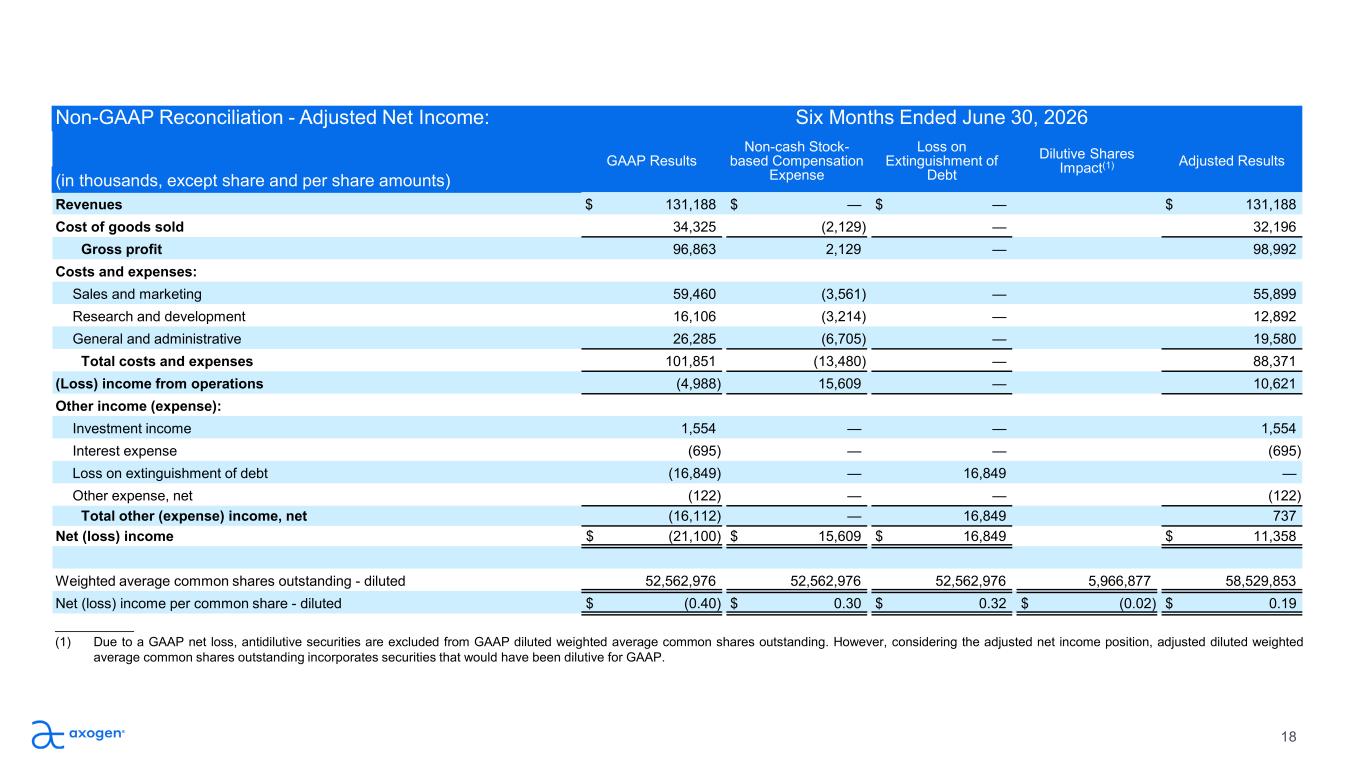
18 Non-GAAP Reconciliation - Adjusted Net Income: Six Months Ended June 30, 2026 GAAP Results Non-cash Stock- based Compensation Expense Loss on Extinguishment of Debt Dilutive Shares Impact(1) Adjusted Results (in thousands, except share and per share amounts) Revenues $ 131,188 $ — $ — $ 131,188 Cost of goods sold 34,325 (2,129) — 32,196 Gross profit 96,863 2,129 — 98,992 Costs and expenses: Sales and marketing 59,460 (3,561) — 55,899 Research and development 16,106 (3,214) — 12,892 General and administrative 26,285 (6,705) — 19,580 Total costs and expenses 101,851 (13,480) — 88,371 (Loss) income from operations (4,988) 15,609 — 10,621 Other income (expense): Investment income 1,554 — — 1,554 Interest expense (695) — — (695) Loss on extinguishment of debt (16,849) — 16,849 — Other expense, net (122) — — (122) Total other (expense) income, net (16,112) — 16,849 737 Net (loss) income $ (21,100) $ 15,609 $ 16,849 $ 11,358 Weighted average common shares outstanding - diluted 52,562,976 52,562,976 52,562,976 5,966,877 58,529,853 Net (loss) income per common share - diluted $ (0.40) $ 0.30 $ 0.32 $ (0.02) $ 0.19 ___________ (1) Due to a GAAP net loss, antidilutive securities are excluded from GAAP diluted weighted average common shares outstanding. However, considering the adjusted net income position, adjusted diluted weighted average common shares outstanding incorporates securities that would have been dilutive for GAAP.
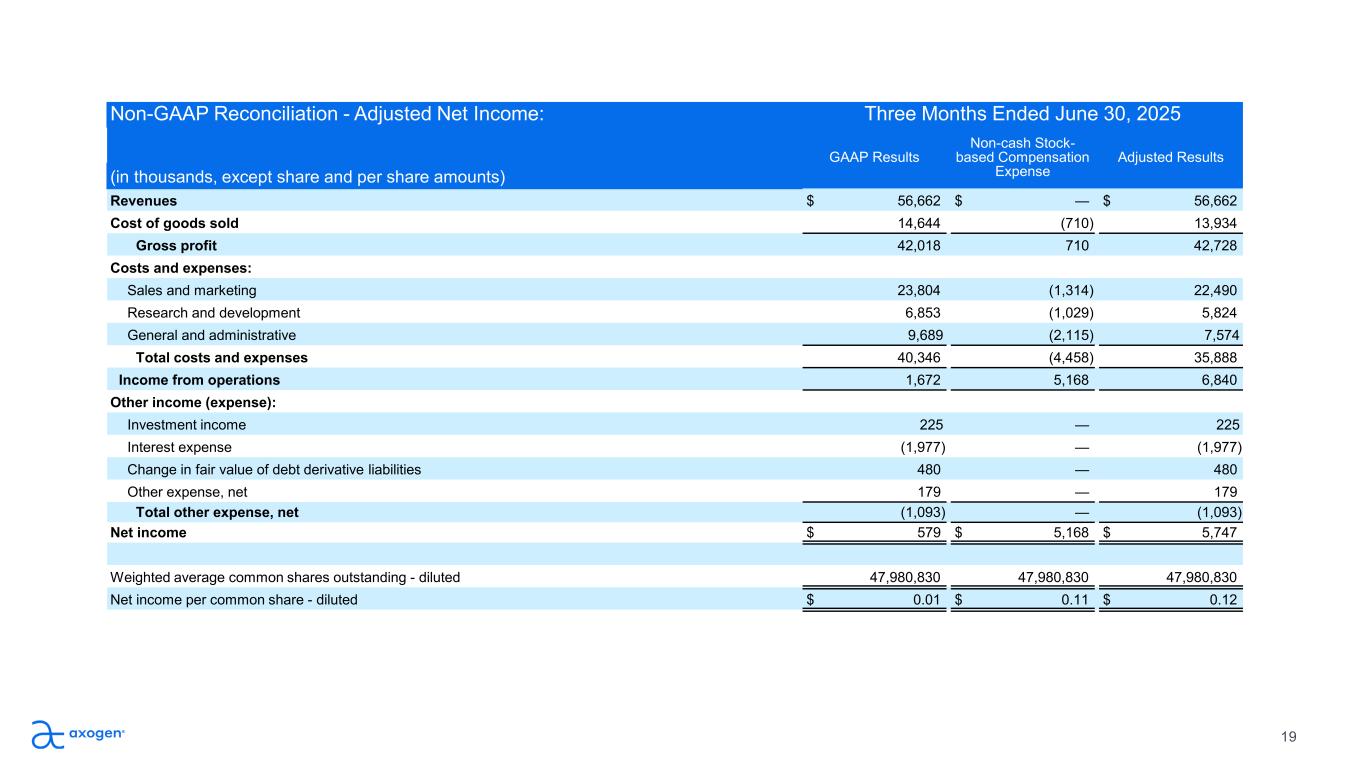
19 Non-GAAP Reconciliation - Adjusted Net Income: Three Months Ended June 30, 2025 GAAP Results Non-cash Stock- based Compensation Expense Adjusted Results (in thousands, except share and per share amounts) Revenues $ 56,662 $ — $ 56,662 Cost of goods sold 14,644 (710) 13,934 Gross profit 42,018 710 42,728 Costs and expenses: Sales and marketing 23,804 (1,314) 22,490 Research and development 6,853 (1,029) 5,824 General and administrative 9,689 (2,115) 7,574 Total costs and expenses 40,346 (4,458) 35,888 Income from operations 1,672 5,168 6,840 Other income (expense): Investment income 225 — 225 Interest expense (1,977) — (1,977) Change in fair value of debt derivative liabilities 480 — 480 Other expense, net 179 — 179 Total other expense, net (1,093) — (1,093) Net income $ 579 $ 5,168 $ 5,747 Weighted average common shares outstanding - diluted 47,980,830 47,980,830 47,980,830 Net income per common share - diluted $ 0.01 $ 0.11 $ 0.12
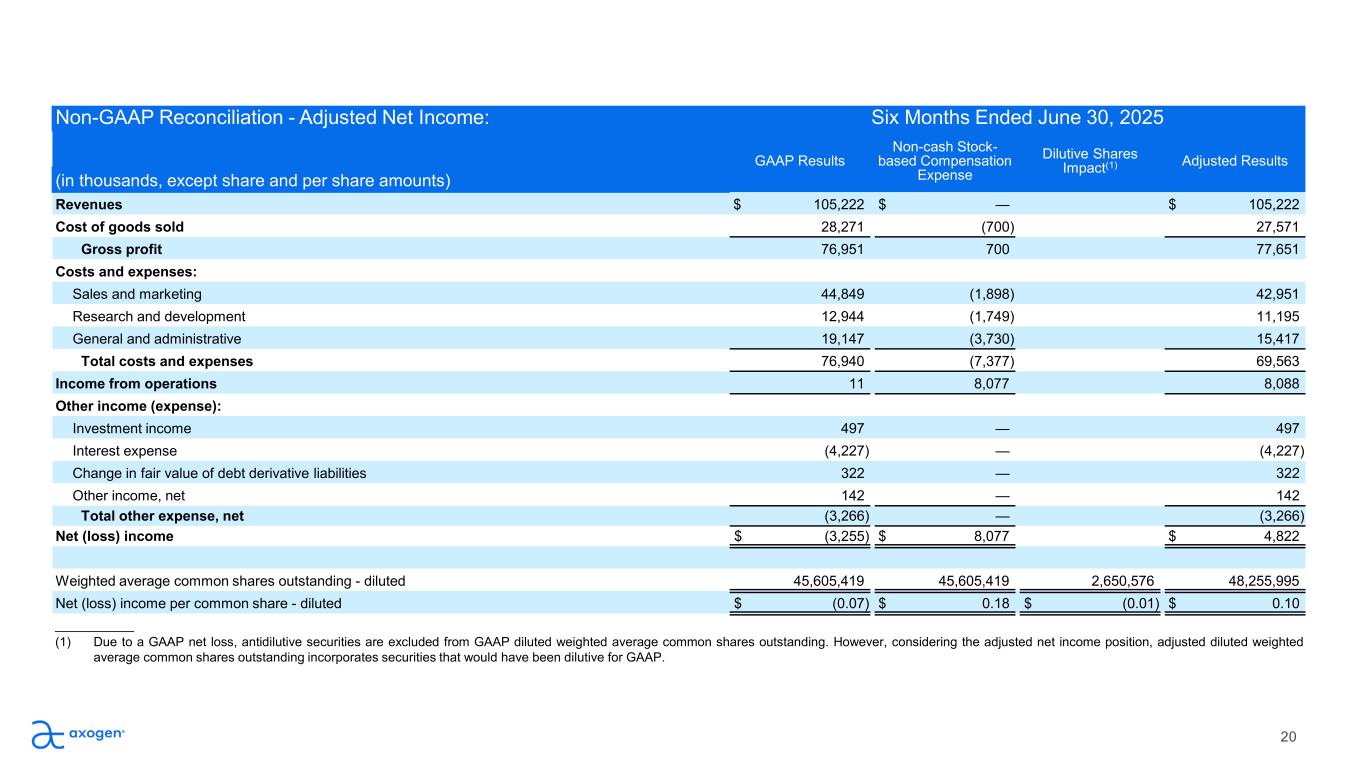
20 Non-GAAP Reconciliation - Adjusted Net Income: Six Months Ended June 30, 2025 GAAP Results Non-cash Stock- based Compensation Expense Dilutive Shares Impact(1) Adjusted Results (in thousands, except share and per share amounts) Revenues $ 105,222 $ — $ 105,222 Cost of goods sold 28,271 (700) 27,571 Gross profit 76,951 700 77,651 Costs and expenses: Sales and marketing 44,849 (1,898) 42,951 Research and development 12,944 (1,749) 11,195 General and administrative 19,147 (3,730) 15,417 Total costs and expenses 76,940 (7,377) 69,563 Income from operations 11 8,077 8,088 Other income (expense): Investment income 497 — 497 Interest expense (4,227) — (4,227) Change in fair value of debt derivative liabilities 322 — 322 Other income, net 142 — 142 Total other expense, net (3,266) — (3,266) Net (loss) income $ (3,255) $ 8,077 $ 4,822 Weighted average common shares outstanding - diluted 45,605,419 45,605,419 2,650,576 48,255,995 Net (loss) income per common share - diluted $ (0.07) $ 0.18 $ (0.01) $ 0.10 ___________ (1) Due to a GAAP net loss, antidilutive securities are excluded from GAAP diluted weighted average common shares outstanding. However, considering the adjusted net income position, adjusted diluted weighted average common shares outstanding incorporates securities that would have been dilutive for GAAP.
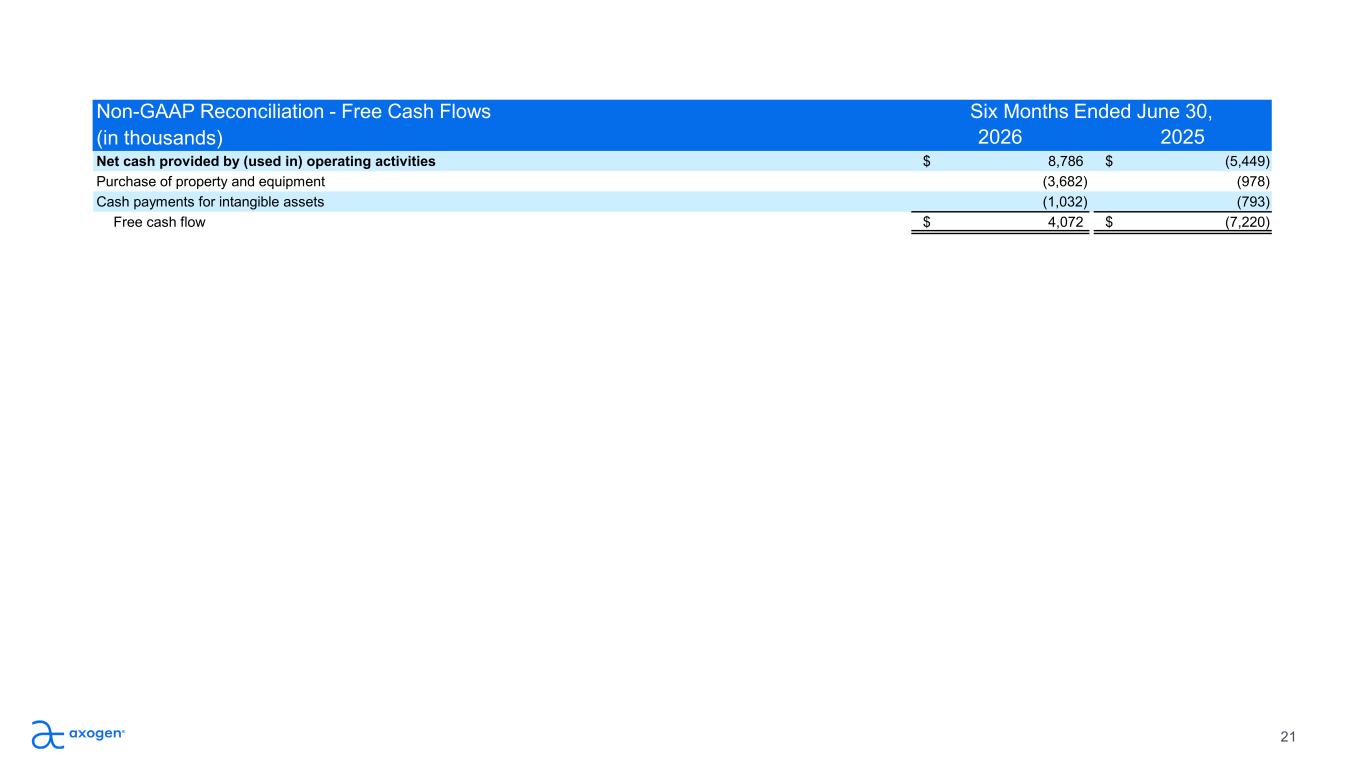
21 Non-GAAP Reconciliation - Free Cash Flows Six Months Ended June 30, (in thousands) 2026 2025 Net cash provided by (used in) operating activities $ 8,786 $ (5,449) Purchase of property and equipment (3,682) (978) Cash payments for intangible assets (1,032) (793) Free cash flow $ 4,072 $ (7,220)
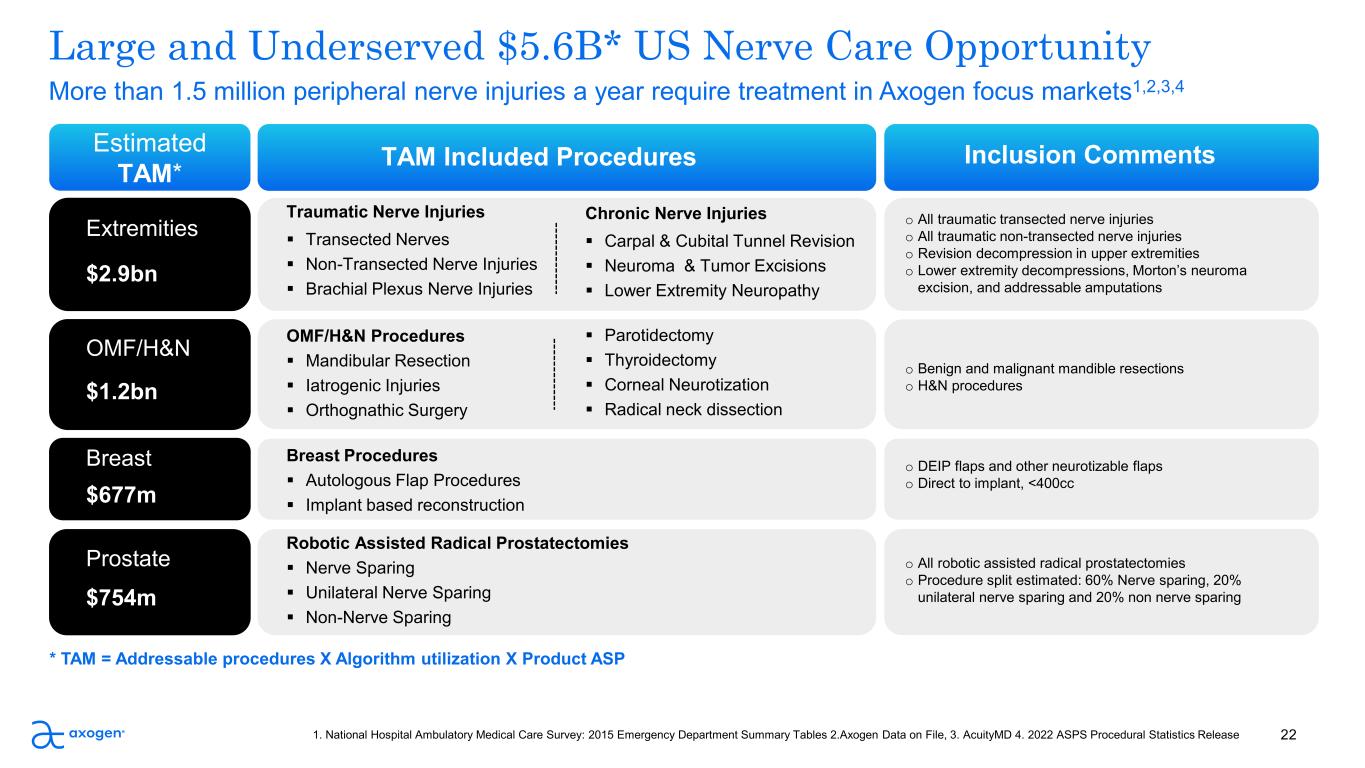
Large and Underserved $5.6B* US Nerve Care Opportunity 22 Traumatic Nerve Injuries Transected Nerves Non-Transected Nerve Injuries Brachial Plexus Nerve Injuries Breast Procedures Autologous Flap Procedures Implant based reconstruction Robotic Assisted Radical Prostatectomies Nerve Sparing Unilateral Nerve Sparing Non-Nerve Sparing Extremities $2.9bn Estimated TAM* OMF/H&N $1.2bn Breast $677m Prostate $754m TAM Included Procedures Chronic Nerve Injuries Carpal & Cubital Tunnel Revision Neuroma & Tumor Excisions Lower Extremity Neuropathy OMF/H&N Procedures Mandibular Resection Iatrogenic Injuries Orthognathic Surgery Parotidectomy Thyroidectomy Corneal Neurotization Radical neck dissection 1. National Hospital Ambulatory Medical Care Survey: 2015 Emergency Department Summary Tables 2.Axogen Data on File, 3. AcuityMD 4. 2022 ASPS Procedural Statistics Release Inclusion Comments o All traumatic transected nerve injuries o All traumatic non-transected nerve injuries o Revision decompression in upper extremities o Lower extremity decompressions, Morton’s neuroma excision, and addressable amputations o Benign and malignant mandible resections o H&N procedures * TAM = Addressable procedures X Algorithm utilization X Product ASP o DEIP flaps and other neurotizable flaps o Direct to implant, <400cc o All robotic assisted radical prostatectomies o Procedure split estimated: 60% Nerve sparing, 20% unilateral nerve sparing and 20% non nerve sparing More than 1.5 million peripheral nerve injuries a year require treatment in Axogen focus markets1,2,3,4
© 2026 Axogen Corporation. All rights reserved. The stylized "a" logo is a registered trademark of Axogen Corporation.