EX-99.2 THIRD QUARTER FINANCIAL RESULTS PRESENTATION
Published on October 28, 2026

Q3 2026 Financial Results October 28, 2026
Forward-looking Statements This presentation contains “forward-looking” statements as defined in the Private Securities Litigation Reform Act of 1995, which are statements that are not historical facts and relate to future conditions, events, or results. These statements are based on management's current expectations or predictions of future conditions, events, or results based on various assumptions and management's estimates of trends and economic factors in the markets in which we are active, as well as our business plans. Words such as “expects,” “anticipates,” “objectives,” “intends,” “plans,” “believes,” “seeks,” “estimates,” “projects,” “forecasts,” “continue,” “may,” “should,” “will,” “goals,” and variations of such words and similar expressions are intended to identify such forward-looking statements. Forward-looking statements include, but are not limited to, statements related to: clinical development activities, including expansion into prostate applications; commercial growth initiatives, including planned expansion of breast and extremities sales specialists; market development opportunities; strategic investments and collaborations, including the anticipated strategic benefits of such investments, including the anticipated benefits and opportunities of the BioCircuit acquisition; expectations regarding disciplined, profitable growth and margin improvement; financial guidance and outlook for 2026, including projected revenue growth, free cash flow, gross margins, and other operating performance metrics; and statements regarding our training and education initiatives, reimbursement and market access efforts, and research and development activities. Actual results or events could differ materially from those described in any forward-looking statements as a result of various factors, including, without limitation, risks related to global supply chain conditions, inflationary pressures, hospital staffing challenges, product development and product potential, clinical enrollment timing and outcomes, regulatory processes and approvals, financial performance, sales growth, surgeon and product adoption, market awareness of our products, data validation, our visibility at and sponsorship of conferences and educational events, geopolitical and macroeconomic conditions, including armed conflicts and government actions or policies that may affect our business, tax position, or regulatory processes, as well as those risk factors described under Part I, Item 1A., “Risk Factors,” of our most recent Annual Report on Form 10-K, subsequent Quarterly Reports on Form 10-Q, and other filings made from time to time with the Securities and Exchange Commission. Forward-looking statements are not a guarantee of future performance, and actual results may differ materially from those projected. Forward-looking statements speak only as of the date they are made and, except as required by applicable law, we assume no responsibility to publicly update or revise any forward-looking statements. 2 About Non-GAAP Financial Measures To supplement our condensed consolidated financial statements, we use the non-GAAP financial measures of EBITDA, which measures earnings before interest, income taxes, depreciation and amortization, EBITDA margin, and Adjusted EBITDA, which further excludes non-cash stock-based compensation expense, BioCircuit transaction and integration costs, and the loss on extinguishment of debt, and Adjusted EBITDA margin. We also use the non-GAAP financial measures of Adjusted Net Income and Adjusted Net Income Per Common Share - diluted which excludes non-cash stock-based compensation expense, BioCircuit transaction and integration costs, and the loss on extinguishment of debt from Net Income (Loss) and Net Income (Loss) Per Common Share - diluted. Additionally, we use the non-GAAP financial measure of Free Cash Flow which consists of net cash provided by operating activities, less expenditures for property and equipment, and intangible assets. These non-GAAP measures are not based on any comprehensive set of accounting rules or principles and should not be considered a substitute for, or superior to, financial measures calculated in accordance with GAAP and may be different from non-GAAP measures used by other companies. In addition, these non-GAAP measures should be read in conjunction with our financial statements prepared in accordance with GAAP. The reconciliations of the non-GAAP measures to the most directly comparable financial measures calculated and presented in accordance with GAAP should be carefully evaluated. We use these non-GAAP financial measures for financial and operational decision-making and as a means to evaluate period-to-period comparisons. We believe that these non-GAAP financial measures provide meaningful supplemental information regarding our performance and that both management and investors benefit from referring to these non-GAAP financial measures in assessing our performance and when planning, forecasting, and analyzing future periods. We believe these non-GAAP financial measures are useful to investors because (1) they allow for greater transparency with respect to key metrics used by management in its financial and operational decision-making and (2) they are used by our institutional investors and the analyst community to help them analyze the performance of our business.
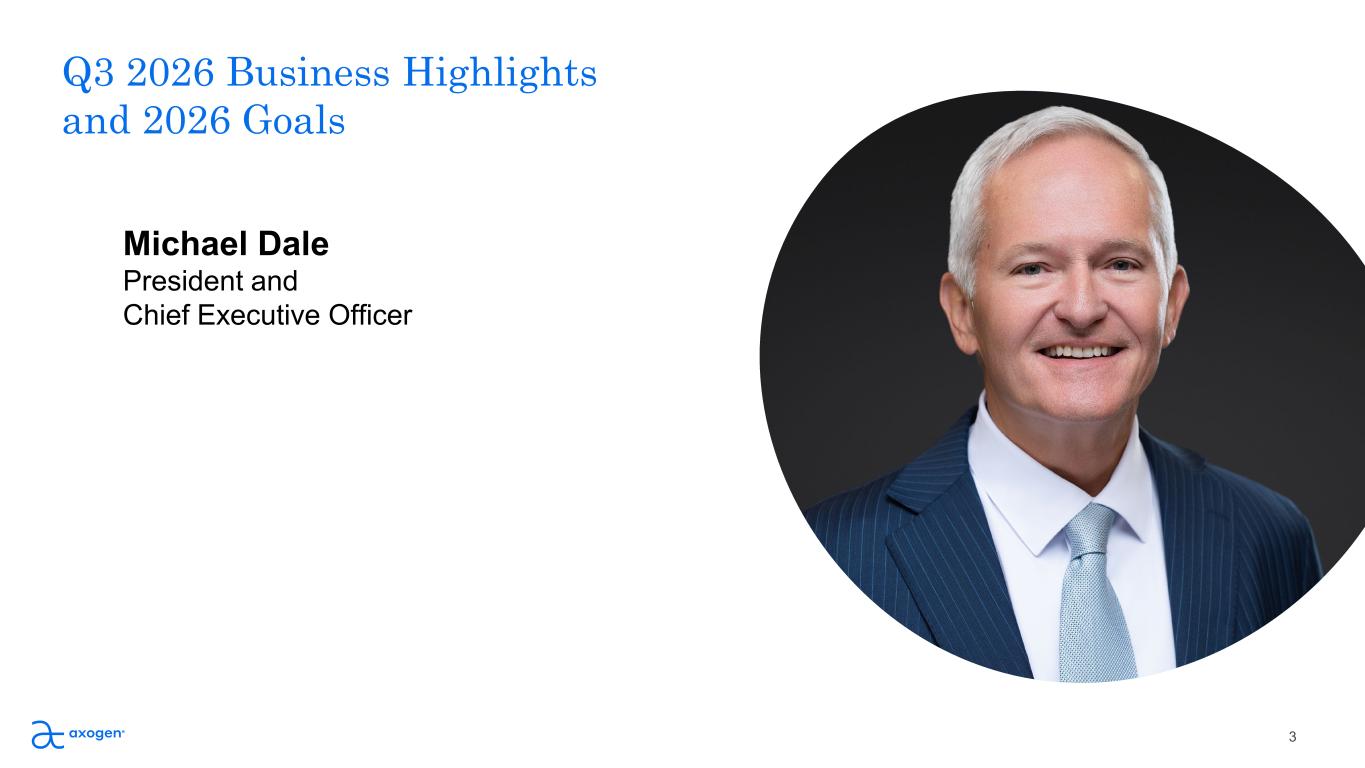
3 Q3 2026 Business Highlights and 2026 Goals Michael Dale President and Chief Executive Officer

Agenda 4 1.Q3 2026 Business Highlights Michael Dale, President and Chief Executive Officer 2.Q3 2026 Financials and 2026 Guidance Lindsey Hartley, Chief Financial Officer 3.Q&A Michael Dale, Lindsey Hartley, Jens Kemp, Chief Marketing Officer Rick Ditto, VP Global Health Economics, Reimbursement & Policy
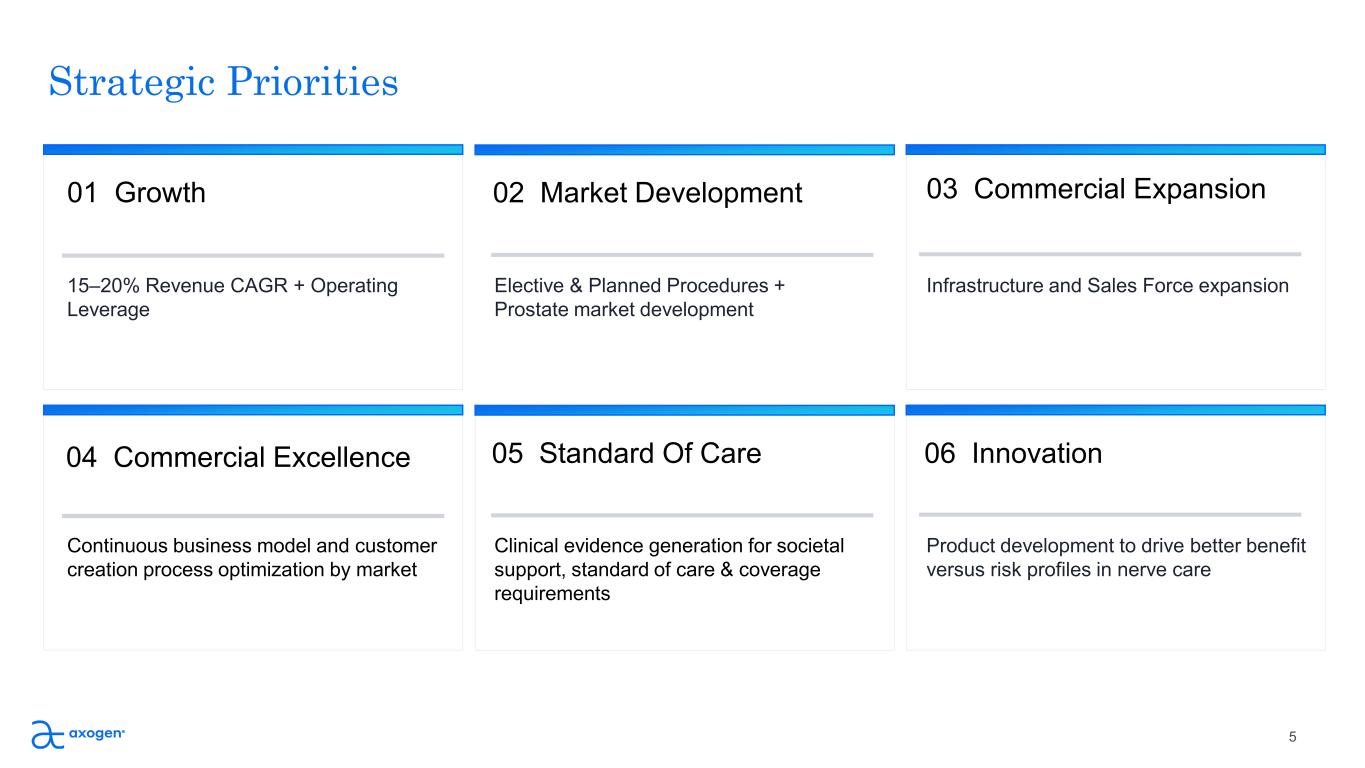
Strategic Priorities 01 Growth 15–20% Revenue CAGR + Operating Leverage 02 Market Development Elective & Planned Procedures + Prostate market development 03 Commercial Expansion Infrastructure and Sales Force expansion 04 Commercial Excellence Continuous business model and customer creation process optimization by market 05 Standard Of Care Clinical evidence generation for societal support, standard of care & coverage requirements 06 Innovation Product development to drive better benefit versus risk profiles in nerve care 5
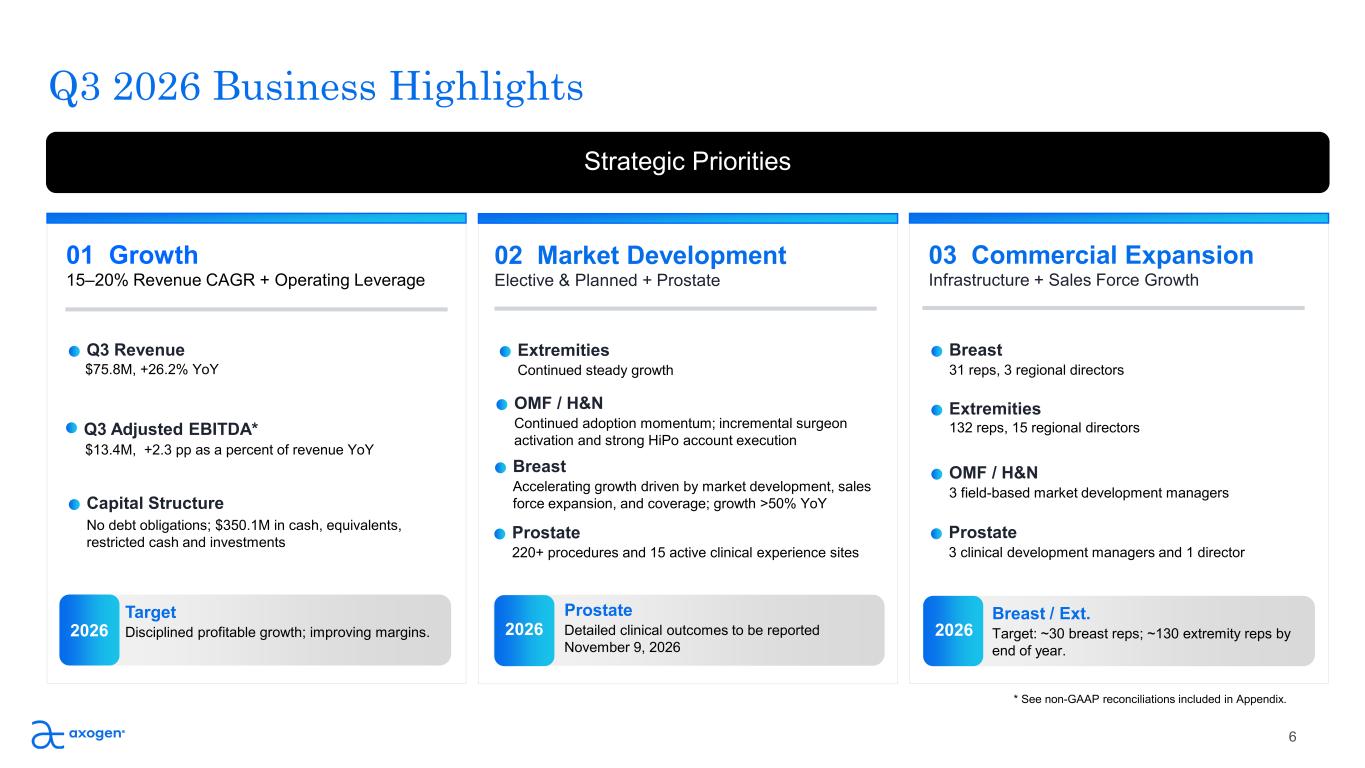
6 Strategic Priorities Q3 2026 Business Highlights 01 Growth 15–20% Revenue CAGR + Operating Leverage Q3 Revenue $75.8M, +26.2% YoY Capital Structure No debt obligations; $350.1M in cash, equivalents, restricted cash and investments 2026 Target Disciplined profitable growth; improving margins. 02 Market Development Elective & Planned + Prostate Extremities Continued steady growth OMF / H&N Continued adoption momentum; incremental surgeon activation and strong HiPo account execution Breast Accelerating growth driven by market development, sales force expansion, and coverage; growth >50% YoY Prostate 220+ procedures and 15 active clinical experience sites 2026 Prostate Detailed clinical outcomes to be reported November 9, 2026 03 Commercial Expansion Infrastructure + Sales Force Growth Breast 31 reps, 3 regional directors Extremities 132 reps, 15 regional directors OMF / H&N 3 field-based market development managers Prostate 3 clinical development managers and 1 director 2026 Breast / Ext. Target: ~30 breast reps; ~130 extremity reps by end of year. 6 Q3 Adjusted EBITDA* $13.4M, +2.3 pp as a percent of revenue YoY * See non-GAAP reconciliations included in Appendix.
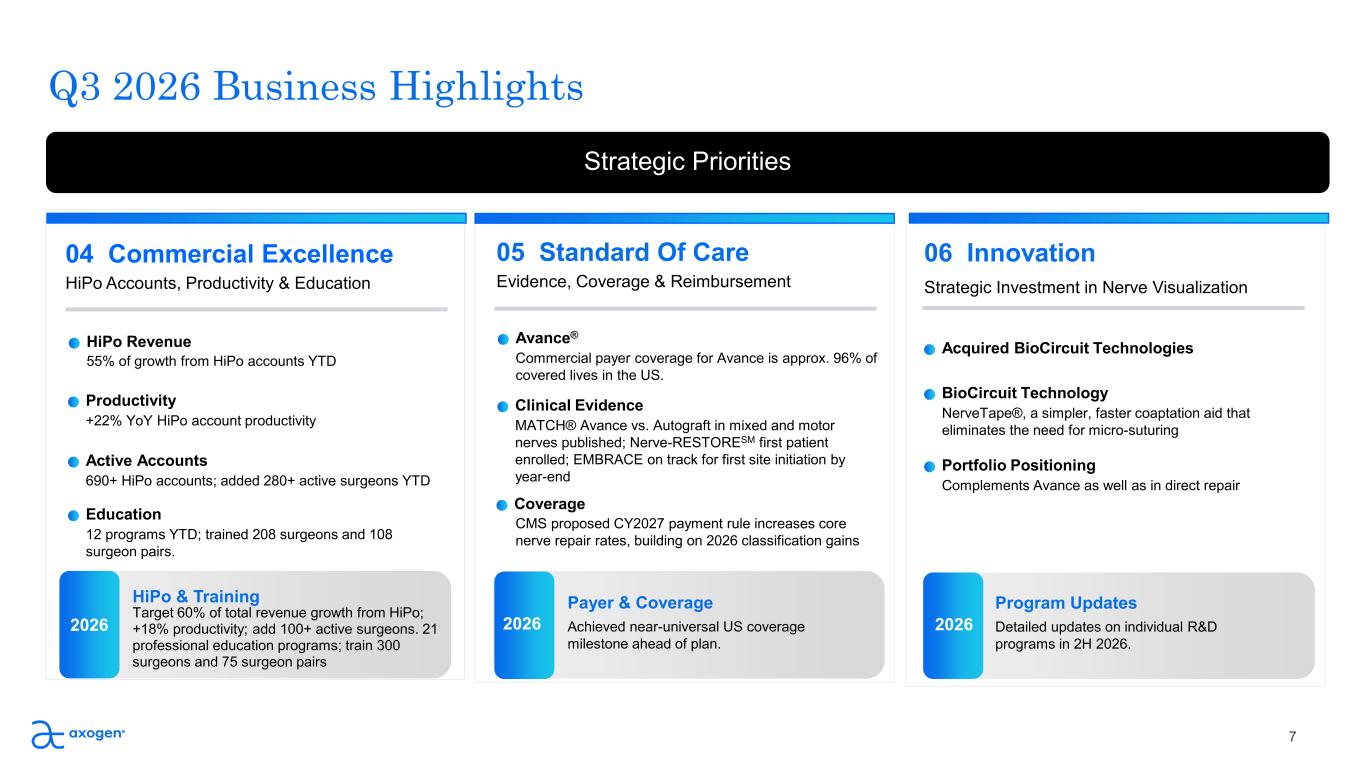
7 Strategic Priorities Q3 2026 Business Highlights 2026 2026 2026 04 Commercial Excellence HiPo Accounts, Productivity & Education HiPo Revenue 55% of growth from HiPo accounts YTD Productivity +22% YoY HiPo account productivity Active Accounts 690+ HiPo accounts; added 280+ active surgeons YTD Education 12 programs YTD; trained 208 surgeons and 108 surgeon pairs. HiPo & Training Target 60% of total revenue growth from HiPo; +18% productivity; add 100+ active surgeons. 21 professional education programs; train 300 surgeons and 75 surgeon pairs 05 Standard Of Care Evidence, Coverage & Reimbursement Avance® Commercial payer coverage for Avance is approx. 96% of covered lives in the US. Clinical Evidence MATCH® Avance vs. Autograft in mixed and motor nerves published; Nerve-RESTORESM first patient enrolled; EMBRACE on track for first site initiation by year-end Coverage CMS proposed CY2027 payment rule increases core nerve repair rates, building on 2026 classification gains Payer & Coverage Achieved near-universal US coverage milestone ahead of plan. 06 Innovation Strategic Investment in Nerve Visualization Program Updates Detailed updates on individual R&D programs in 2H 2026. Acquired BioCircuit Technologies BioCircuit Technology NerveTape®, a simpler, faster coaptation aid that eliminates the need for micro-suturing Portfolio Positioning Complements Avance as well as in direct repair 7
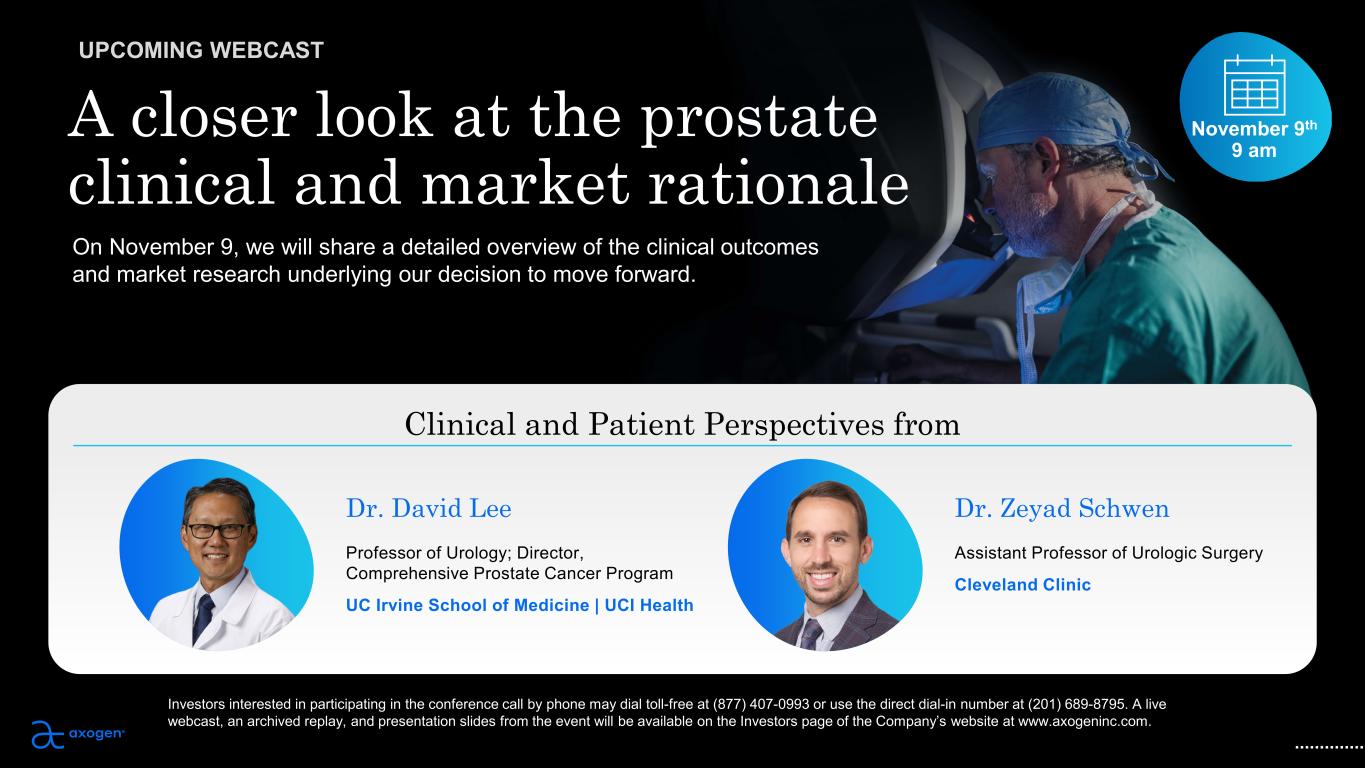
Professor of Urology; Director, Comprehensive Prostate Cancer Program UC Irvine School of Medicine | UCI Health Dr. David Lee Assistant Professor of Urologic Surgery Cleveland Clinic Dr. Zeyad Schwen 8 UPCOMING WEBCAST A closer look at the prostate clinical and market rationale On November 9, we will share a detailed overview of the clinical outcomes and market research underlying our decision to move forward. Clinical and Patient Perspectives from November 9th 9 am Investors interested in participating in the conference call by phone may dial toll-free at (877) 407-0993 or use the direct dial-in number at (201) 689-8795. A live webcast, an archived replay, and presentation slides from the event will be available on the Investors page of the Company’s website at www.axogeninc.com.

9 Q3 Financials and 2026 Guidance Discussion Lindsey Hartley Chief Financial Officer
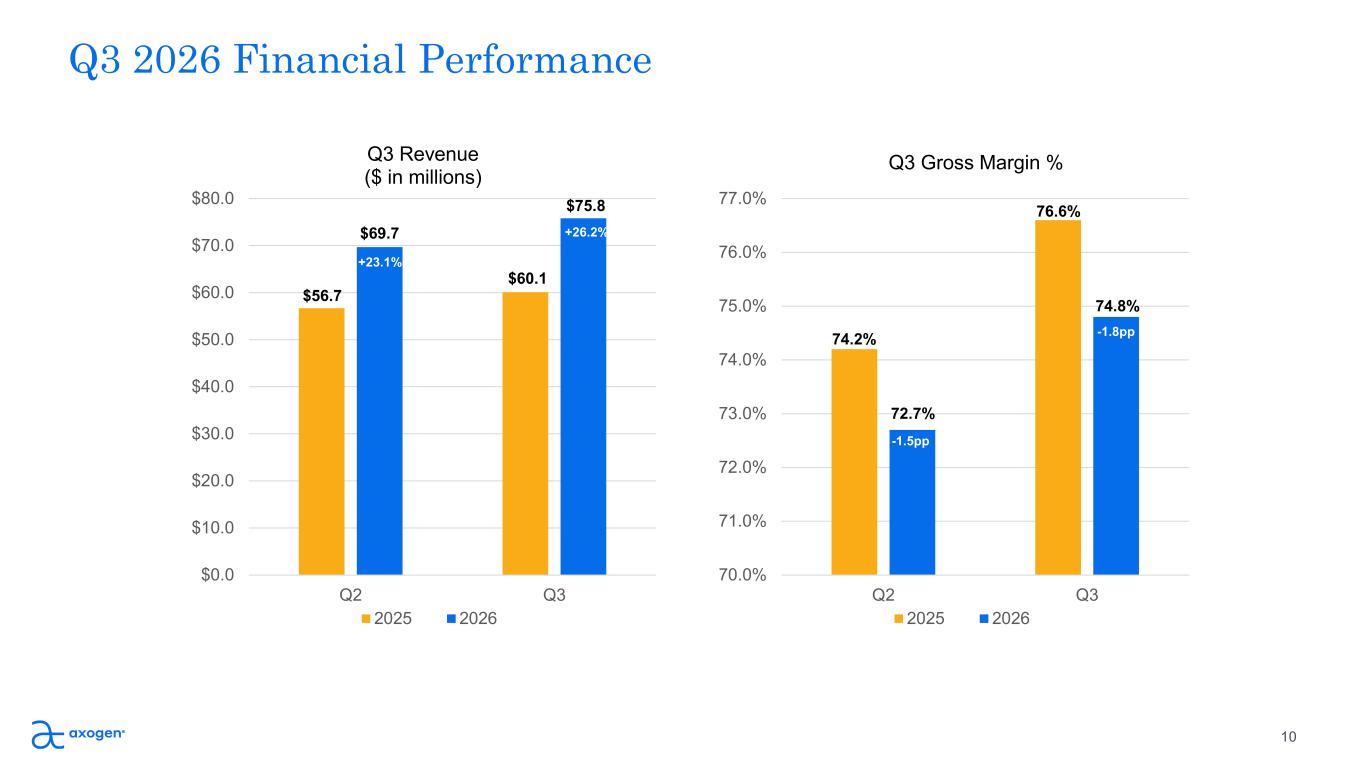
Q3 2026 Financial Performance 10 +26.6% $0.0 $10.0 $20.0 $30.0 $40.0 $50.0 $60.0 $70.0 $80.0 Q2 Q3 Q3 Revenue ($ in millions) 2025 2026 $69.7 $56.7 +23.1% 70.0% 71.0% 72.0% 73.0% 74.0% 75.0% 76.0% 77.0% Q2 Q3 Q3 Gross Margin % 2025 2026 72.7% 74.2% -1.5pp 76.6% 74.8% +3.3pp $60.1 $75.8 +26.2% -1.8pp
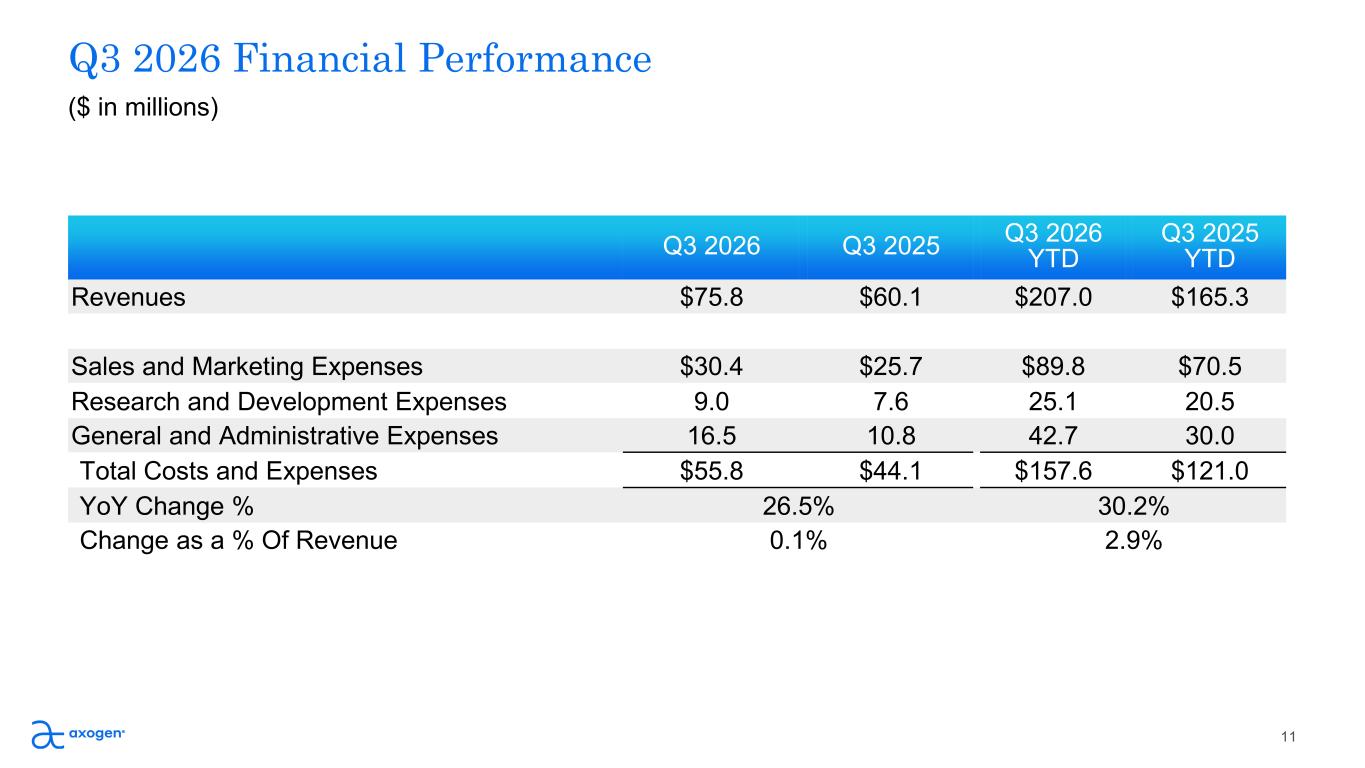
Q3 2026 Financial Performance 11 Q3 2026 Q3 2025 Q3 2026 YTD Q3 2025 YTD Revenues $75.8 $60.1 $207.0 $165.3 Sales and Marketing Expenses $30.4 $25.7 $89.8 $70.5 Research and Development Expenses 9.0 7.6 25.1 20.5 General and Administrative Expenses 16.5 10.8 42.7 30.0 Total Costs and Expenses $55.8 $44.1 $157.6 $121.0 YoY Change % 26.5% 30.2% Change as a % Of Revenue 0.1% 2.9% ($ in millions)
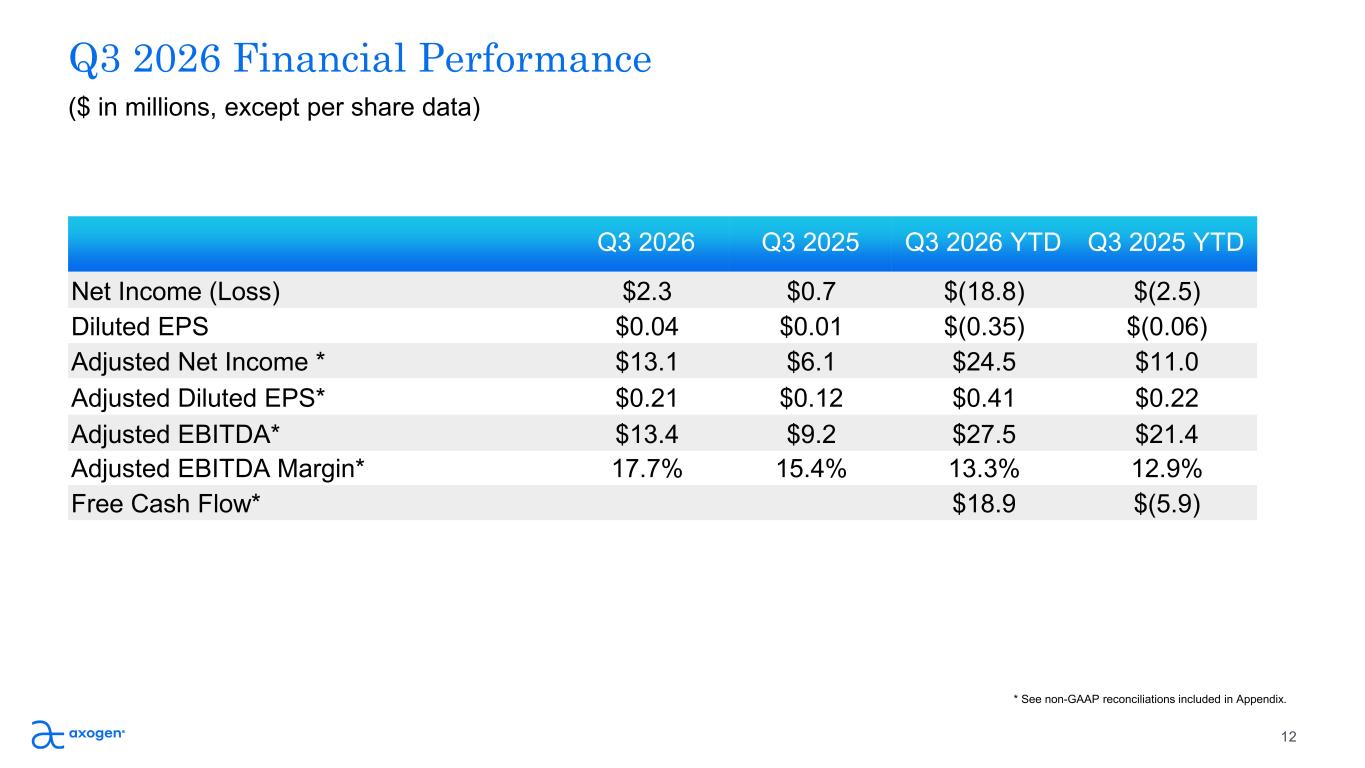
12 Q3 2026 Q3 2025 Q3 2026 YTD Q3 2025 YTD Net Income (Loss) $2.3 $0.7 $(18.8) $(2.5) Diluted EPS $0.04 $0.01 $(0.35) $(0.06) Adjusted Net Income * $13.1 $6.1 $24.5 $11.0 Adjusted Diluted EPS* $0.21 $0.12 $0.41 $0.22 Adjusted EBITDA* $13.4 $9.2 $27.5 $21.4 Adjusted EBITDA Margin* 17.7% 15.4% 13.3% 12.9% Free Cash Flow* $18.9 $(5.9) Q3 2026 Financial Performance ($ in millions, except per share data) * See non-GAAP reconciliations included in Appendix.
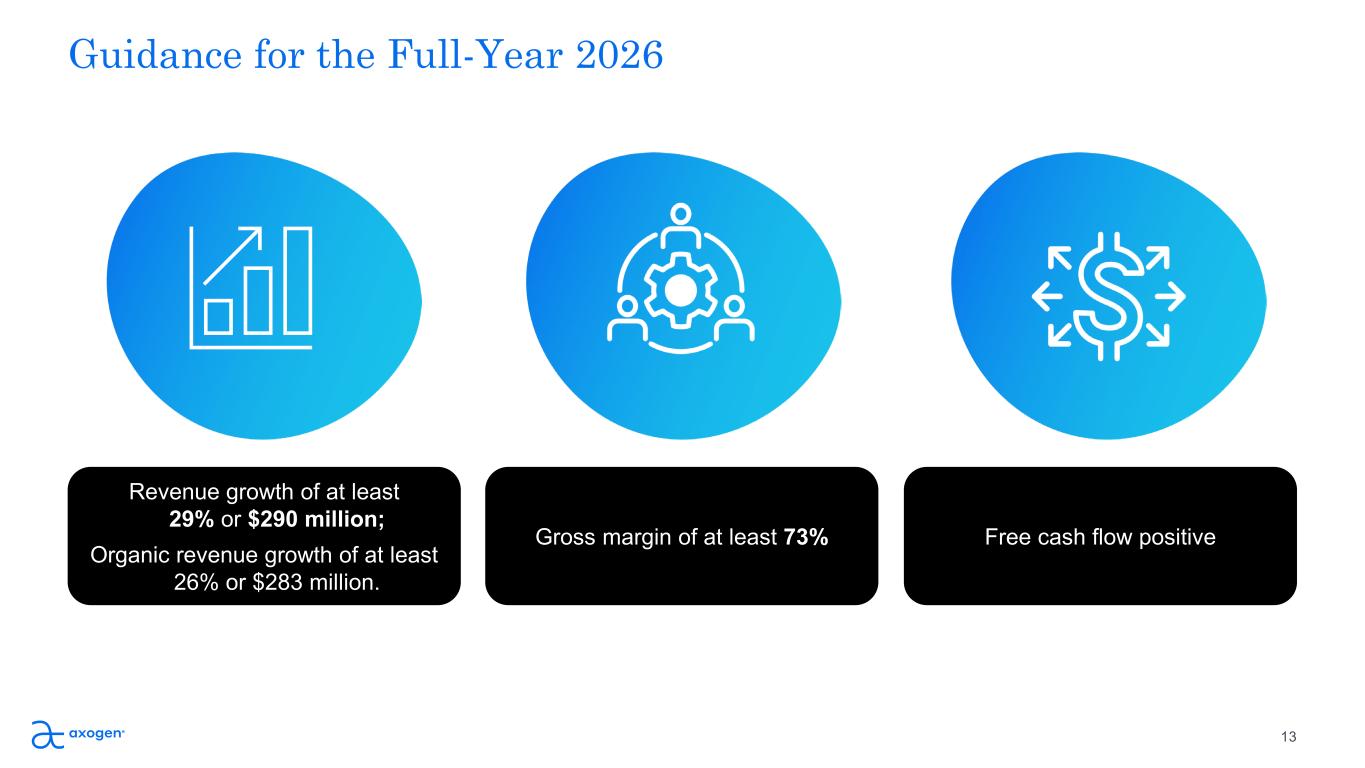
Guidance for the Full-Year 2026 13 Free cash flow positiveGross margin of at least 73% Revenue growth of at least 29% or $290 million; Organic revenue growth of at least 26% or $283 million.

President and Chief Executive Officer Michael Dale Chief Marketing Officer Jens Kemp VP, Global Health Economics, Reimbursement & Policy Rick Ditto 14 Chief Financial Officer Lindsey Hartley Q&A

Thank you © 2026 Axogen Corporation. All rights reserved. The stylized "a" logo is a registered trademark of Axogen Corporation.

Appendix 16
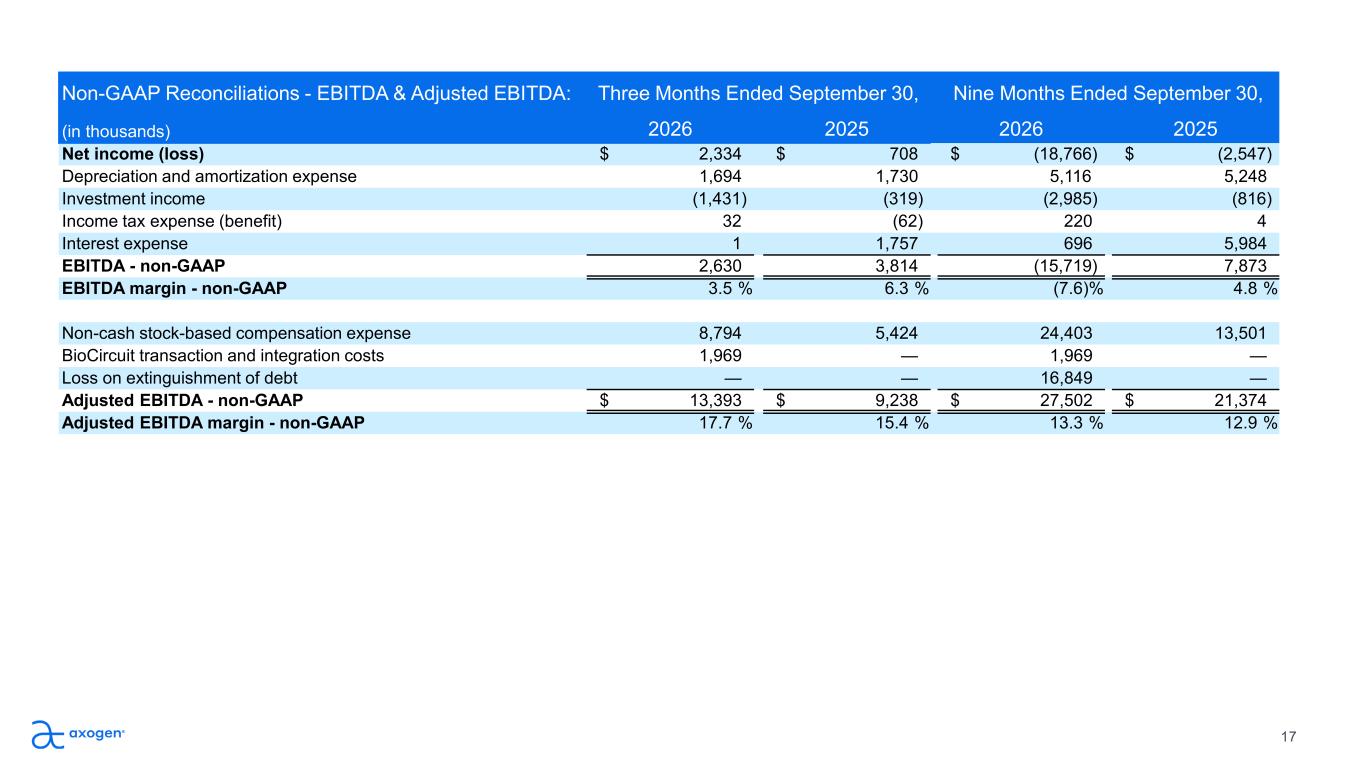
17 Non-GAAP Reconciliations - EBITDA & Adjusted EBITDA: Three Months Ended September 30, Nine Months Ended September 30, (in thousands) 2026 2025 2026 2025 Net income (loss) $ 2,334 $ 708 $ (18,766) $ (2,547) Depreciation and amortization expense 1,694 1,730 5,116 5,248 Investment income (1,431) (319) (2,985) (816) Income tax expense (benefit) 32 (62) 220 4 Interest expense 1 1,757 696 5,984 EBITDA - non-GAAP 2,630 3,814 (15,719) 7,873 EBITDA margin - non-GAAP 3.5 % 6.3 % (7.6)% 4.8 % Non-cash stock-based compensation expense 8,794 5,424 24,403 13,501 BioCircuit transaction and integration costs 1,969 — 1,969 — Loss on extinguishment of debt — — 16,849 — Adjusted EBITDA - non-GAAP $ 13,393 $ 9,238 $ 27,502 $ 21,374 Adjusted EBITDA margin - non-GAAP 17.7 % 15.4 % 13.3 % 12.9 %
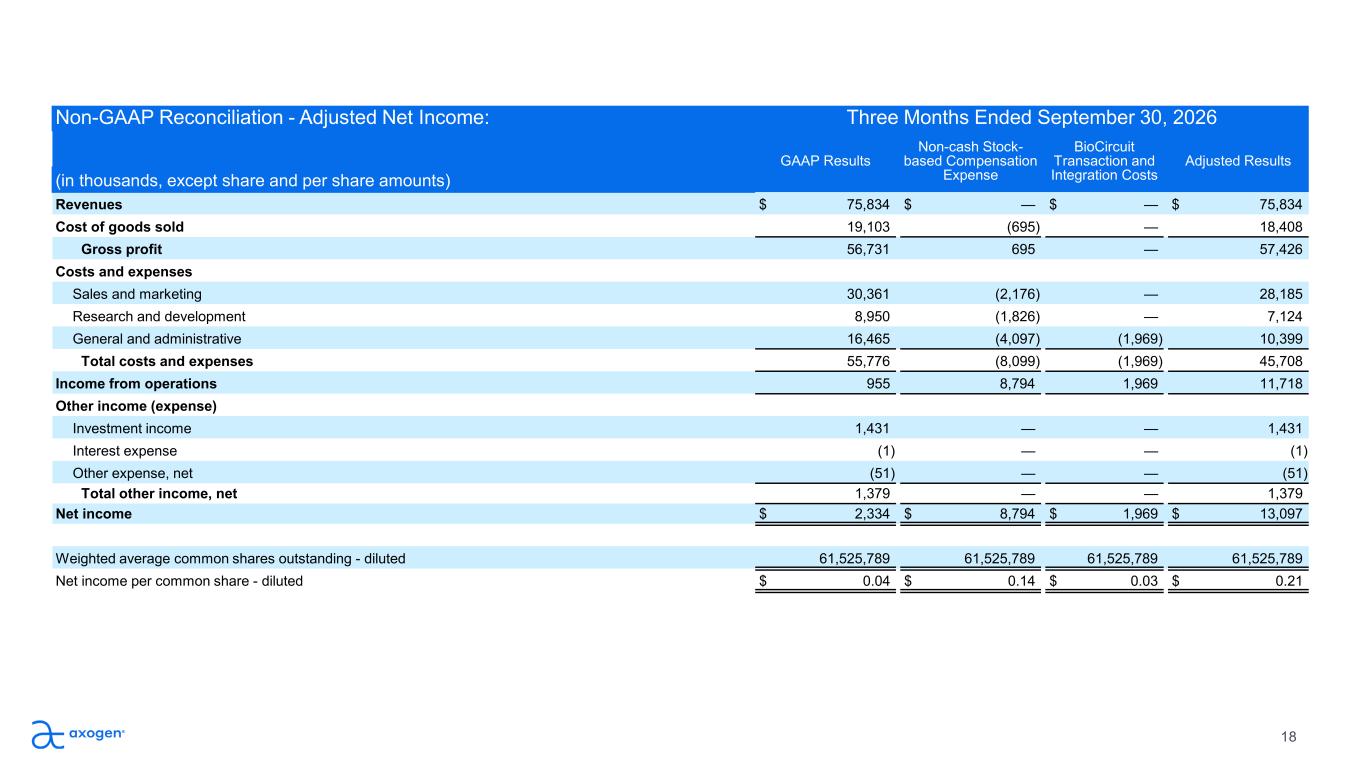
18 Non-GAAP Reconciliation - Adjusted Net Income: Three Months Ended September 30, 2026 GAAP Results Non-cash Stock- based Compensation Expense BioCircuit Transaction and Integration Costs Adjusted Results (in thousands, except share and per share amounts) Revenues $ 75,834 $ — $ — $ 75,834 Cost of goods sold 19,103 (695) — 18,408 Gross profit 56,731 695 — 57,426 Costs and expenses Sales and marketing 30,361 (2,176) — 28,185 Research and development 8,950 (1,826) — 7,124 General and administrative 16,465 (4,097) (1,969) 10,399 Total costs and expenses 55,776 (8,099) (1,969) 45,708 Income from operations 955 8,794 1,969 11,718 Other income (expense) Investment income 1,431 — — 1,431 Interest expense (1) — — (1) Other expense, net (51) — — (51) Total other income, net 1,379 — — 1,379 Net income $ 2,334 $ 8,794 $ 1,969 $ 13,097 Weighted average common shares outstanding - diluted 61,525,789 61,525,789 61,525,789 61,525,789 Net income per common share - diluted $ 0.04 $ 0.14 $ 0.03 $ 0.21
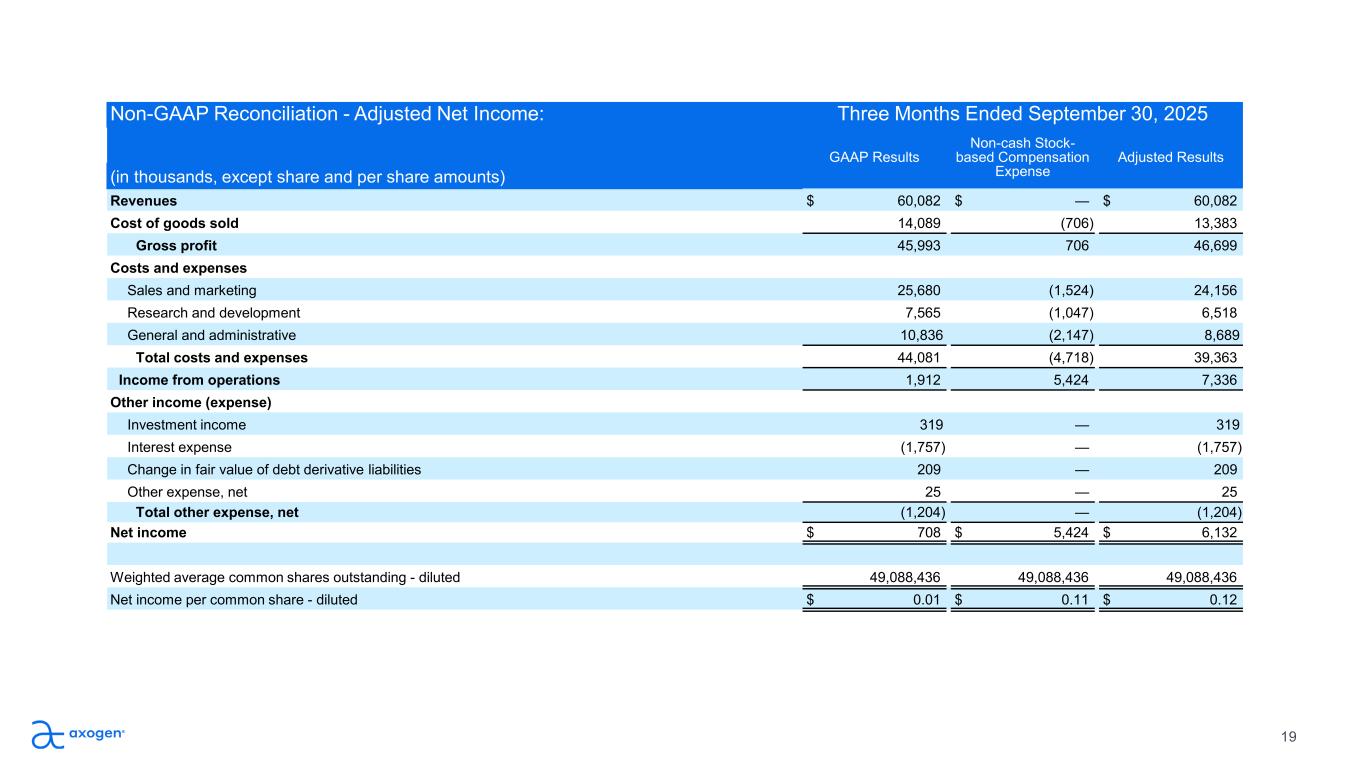
19 Non-GAAP Reconciliation - Adjusted Net Income: Three Months Ended September 30, 2025 GAAP Results Non-cash Stock- based Compensation Expense Adjusted Results (in thousands, except share and per share amounts) Revenues $ 60,082 $ — $ 60,082 Cost of goods sold 14,089 (706) 13,383 Gross profit 45,993 706 46,699 Costs and expenses Sales and marketing 25,680 (1,524) 24,156 Research and development 7,565 (1,047) 6,518 General and administrative 10,836 (2,147) 8,689 Total costs and expenses 44,081 (4,718) 39,363 Income from operations 1,912 5,424 7,336 Other income (expense) Investment income 319 — 319 Interest expense (1,757) — (1,757) Change in fair value of debt derivative liabilities 209 — 209 Other expense, net 25 — 25 Total other expense, net (1,204) — (1,204) Net income $ 708 $ 5,424 $ 6,132 Weighted average common shares outstanding - diluted 49,088,436 49,088,436 49,088,436 Net income per common share - diluted $ 0.01 $ 0.11 $ 0.12
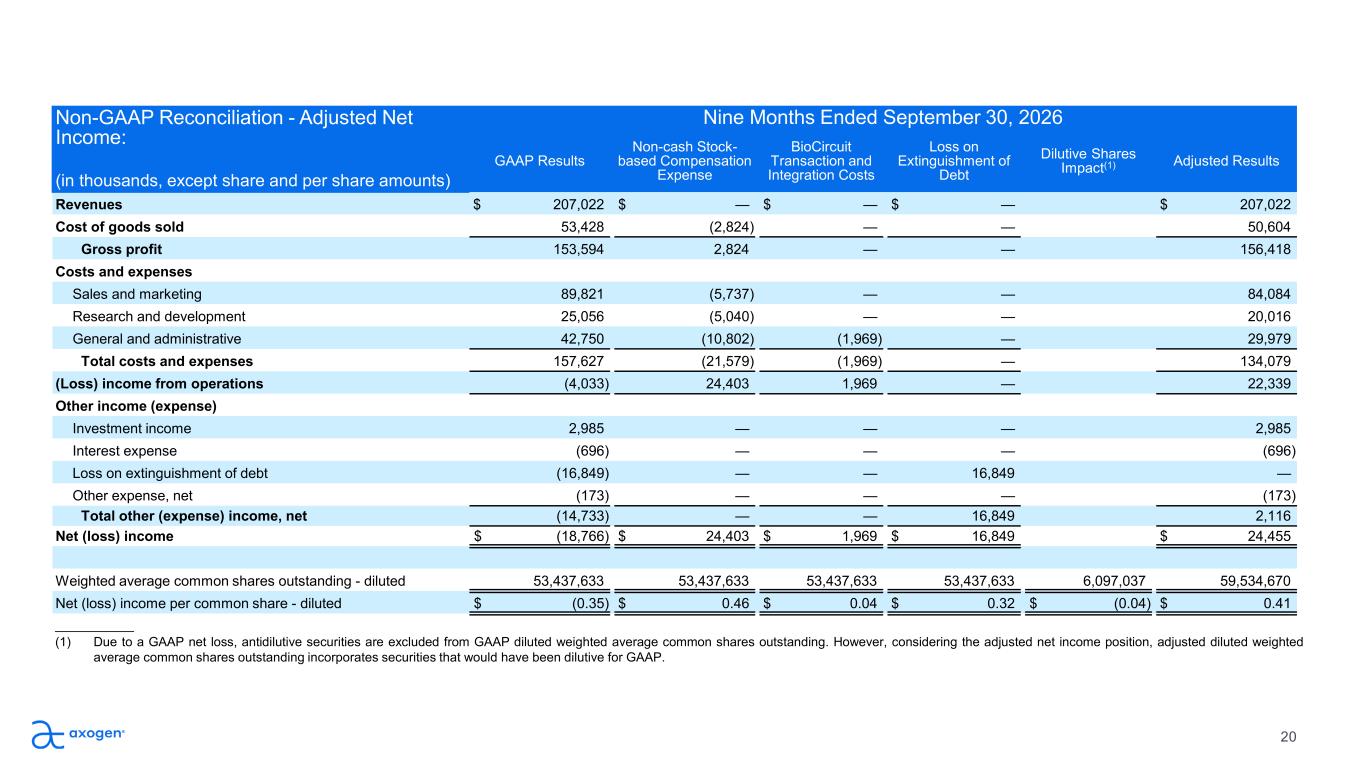
20 Non-GAAP Reconciliation - Adjusted Net Income: Nine Months Ended September 30, 2026 GAAP Results Non-cash Stock- based Compensation Expense BioCircuit Transaction and Integration Costs Loss on Extinguishment of Debt Dilutive Shares Impact(1) Adjusted Results (in thousands, except share and per share amounts) Revenues $ 207,022 $ — $ — $ — $ 207,022 Cost of goods sold 53,428 (2,824) — — 50,604 Gross profit 153,594 2,824 — — 156,418 Costs and expenses Sales and marketing 89,821 (5,737) — — 84,084 Research and development 25,056 (5,040) — — 20,016 General and administrative 42,750 (10,802) (1,969) — 29,979 Total costs and expenses 157,627 (21,579) (1,969) — 134,079 (Loss) income from operations (4,033) 24,403 1,969 — 22,339 Other income (expense) Investment income 2,985 — — — 2,985 Interest expense (696) — — — (696) Loss on extinguishment of debt (16,849) — — 16,849 — Other expense, net (173) — — — (173) Total other (expense) income, net (14,733) — — 16,849 2,116 Net (loss) income $ (18,766) $ 24,403 $ 1,969 $ 16,849 $ 24,455 Weighted average common shares outstanding - diluted 53,437,633 53,437,633 53,437,633 53,437,633 6,097,037 59,534,670 Net (loss) income per common share - diluted $ (0.35) $ 0.46 $ 0.04 $ 0.32 $ (0.04) $ 0.41 ___________ (1) Due to a GAAP net loss, antidilutive securities are excluded from GAAP diluted weighted average common shares outstanding. However, considering the adjusted net income position, adjusted diluted weighted average common shares outstanding incorporates securities that would have been dilutive for GAAP.
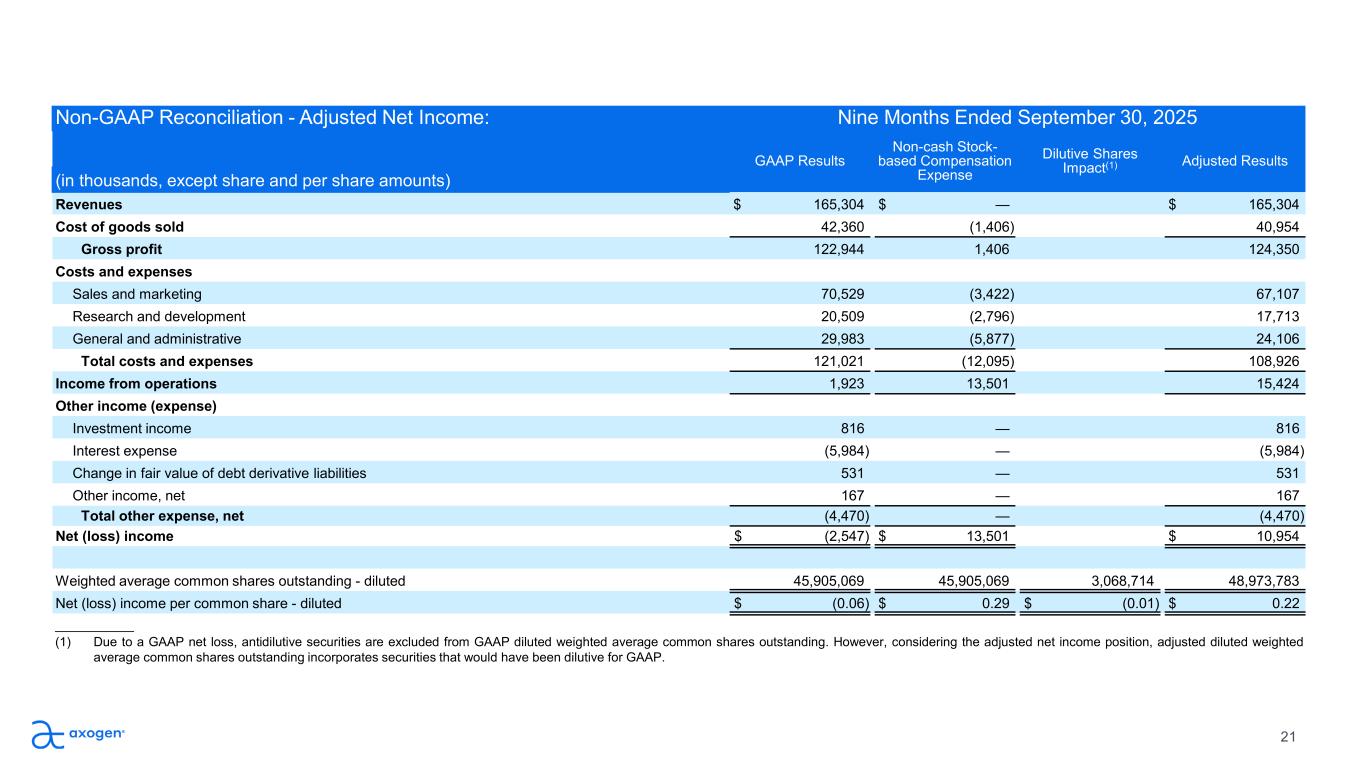
21 Non-GAAP Reconciliation - Adjusted Net Income: Nine Months Ended September 30, 2025 GAAP Results Non-cash Stock- based Compensation Expense Dilutive Shares Impact(1) Adjusted Results (in thousands, except share and per share amounts) Revenues $ 165,304 $ — $ 165,304 Cost of goods sold 42,360 (1,406) 40,954 Gross profit 122,944 1,406 124,350 Costs and expenses Sales and marketing 70,529 (3,422) 67,107 Research and development 20,509 (2,796) 17,713 General and administrative 29,983 (5,877) 24,106 Total costs and expenses 121,021 (12,095) 108,926 Income from operations 1,923 13,501 15,424 Other income (expense) Investment income 816 — 816 Interest expense (5,984) — (5,984) Change in fair value of debt derivative liabilities 531 — 531 Other income, net 167 — 167 Total other expense, net (4,470) — (4,470) Net (loss) income $ (2,547) $ 13,501 $ 10,954 Weighted average common shares outstanding - diluted 45,905,069 45,905,069 3,068,714 48,973,783 Net (loss) income per common share - diluted $ (0.06) $ 0.29 $ (0.01) $ 0.22 ___________ (1) Due to a GAAP net loss, antidilutive securities are excluded from GAAP diluted weighted average common shares outstanding. However, considering the adjusted net income position, adjusted diluted weighted average common shares outstanding incorporates securities that would have been dilutive for GAAP.
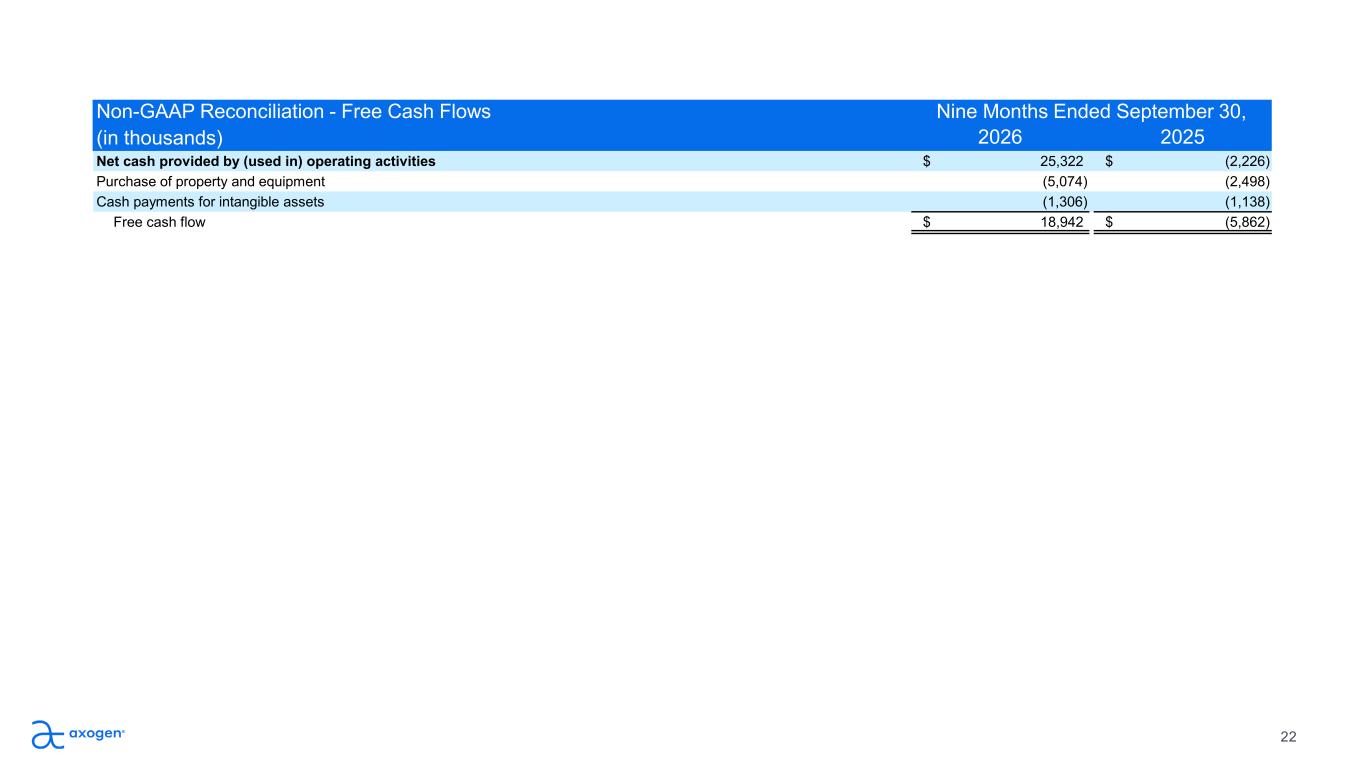
22 Non-GAAP Reconciliation - Free Cash Flows Nine Months Ended September 30, (in thousands) 2026 2025 Net cash provided by (used in) operating activities $ 25,322 $ (2,226) Purchase of property and equipment (5,074) (2,498) Cash payments for intangible assets (1,306) (1,138) Free cash flow $ 18,942 $ (5,862)
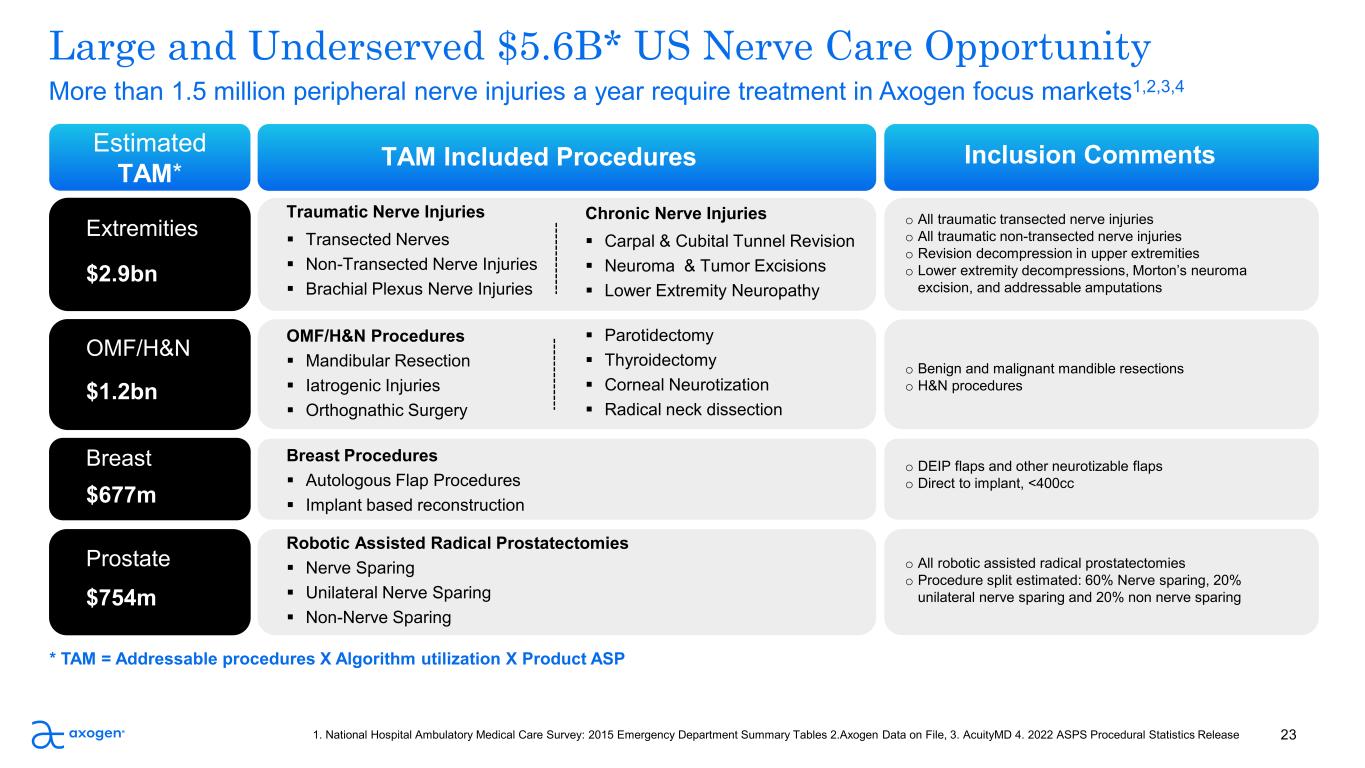
Large and Underserved $5.6B* US Nerve Care Opportunity 23 Traumatic Nerve Injuries Transected Nerves Non-Transected Nerve Injuries Brachial Plexus Nerve Injuries Breast Procedures Autologous Flap Procedures Implant based reconstruction Robotic Assisted Radical Prostatectomies Nerve Sparing Unilateral Nerve Sparing Non-Nerve Sparing Extremities $2.9bn Estimated TAM* OMF/H&N $1.2bn Breast $677m Prostate $754m TAM Included Procedures Chronic Nerve Injuries Carpal & Cubital Tunnel Revision Neuroma & Tumor Excisions Lower Extremity Neuropathy OMF/H&N Procedures Mandibular Resection Iatrogenic Injuries Orthognathic Surgery Parotidectomy Thyroidectomy Corneal Neurotization Radical neck dissection 1. National Hospital Ambulatory Medical Care Survey: 2015 Emergency Department Summary Tables 2.Axogen Data on File, 3. AcuityMD 4. 2022 ASPS Procedural Statistics Release Inclusion Comments o All traumatic transected nerve injuries o All traumatic non-transected nerve injuries o Revision decompression in upper extremities o Lower extremity decompressions, Morton’s neuroma excision, and addressable amputations o Benign and malignant mandible resections o H&N procedures * TAM = Addressable procedures X Algorithm utilization X Product ASP o DEIP flaps and other neurotizable flaps o Direct to implant, <400cc o All robotic assisted radical prostatectomies o Procedure split estimated: 60% Nerve sparing, 20% unilateral nerve sparing and 20% non nerve sparing More than 1.5 million peripheral nerve injuries a year require treatment in Axogen focus markets1,2,3,4
© 2026 Axogen Corporation. All rights reserved. The stylized "a" logo is a registered trademark of Axogen Corporation.